The securities finance business is off to a strong start in 2016. DataLend has seen a substantial increase in on-loan values from the beginning of this year. January saw the lender-to-broker on-loan balances of approximately $1.65 trillion. That has grown to almost $1.85 trillion as of today. Broker-to-broker on-loan balances have also increased from about $236 billion in early January to around $262 billion today. These on-loan value increases mirror an uptick in global fees to borrow across all asset classes, which have risen from 45 basis points (bps) in early January to almost 50 bps today. The increase in on-loan values is also reflected in global utilization, which has risen from 12% in January to almost 14% today.
If we look at global demand by asset class, the on-loan value for both equities and fixed income is up. The on-loan value for equities increased from $854 billion on January 1 to just over $1.03 trillion today. Fixed income balances are up too, from $792 billion to $830 billion today.
Trend 1: Hottest sectors remain hot
Energy was definitely the hottest sector in 2015 and continues to be today. The global energy sector averaged 116 bps for the past 12 months. Oil & Gas Drilling and Coal & Consumable Fuels were the two hottest industries in the sector at 278 bps and 314 bps, respectively, averaged over the past 12 months. The energy sector has cooled recently as oil prices appear to have stabilized; the volume-weighted average fee (VWAF) is averaging just below 100 bps at present, but fees to borrow global energy securities are still eclipsing other sectors.
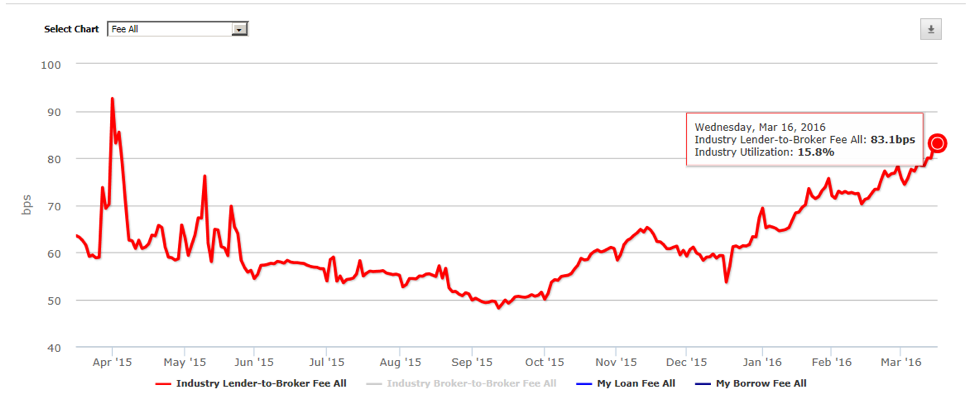
Meanwhile, we are seeing an increase in VWAF in the global Consumer Discretionary sector, up to 83 bps (see graph 1). This dovetails with an increase in on-loan value for the sector from just under $150 billion in early January to $176 billion today.
Graph 1: Global consumer discretionary fees to borrow
Trend 2: Highs in South America
When looking at regional trends, we’re seeing an increased appetite to borrow South American securities, with fees to borrow all asset classes in this region recently hitting a high of 115 bps.
Graph 2: Brazil fees to borrow
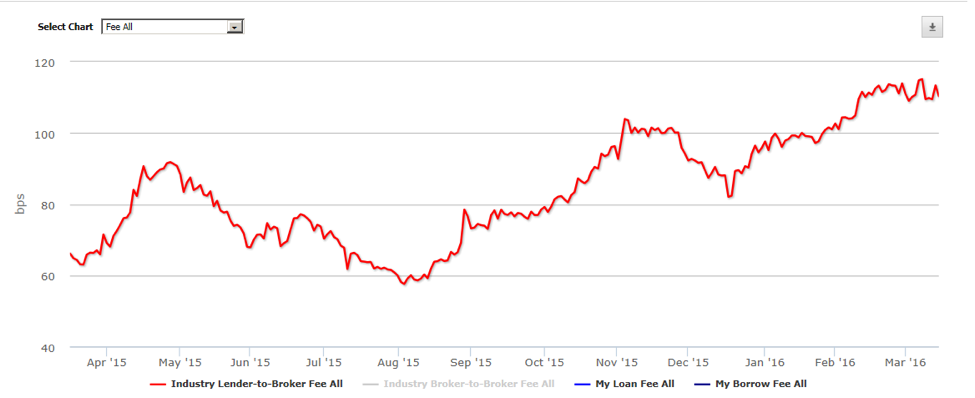
The increase in borrow fees in South America can be chiefly attributed to Brazil. Fees to borrow this market recently peaked at 353 bps before dropping a bit per (see graph 2). Daily average on-loan balances for Brazil have been approximately $3.14 billion for the past 12 months, and utilization is strong at an average of almost 29% for the same timeframe.
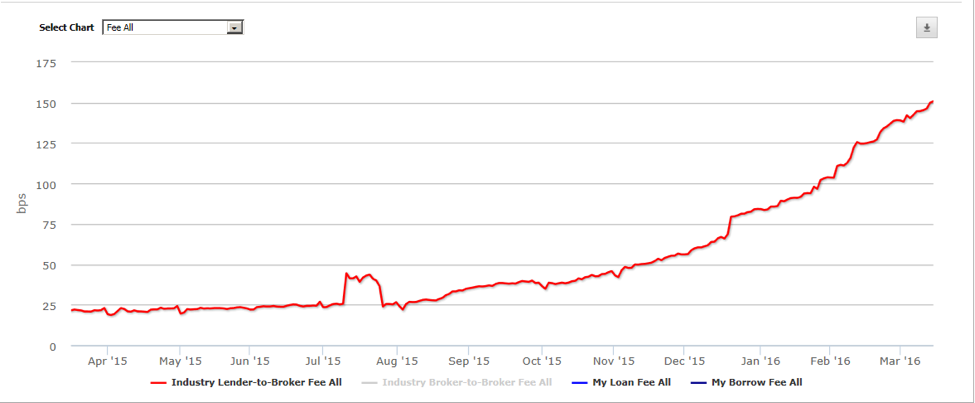
Chile is another market in South America heating up. Fees have recently increased to 150 bps (see graph 3). Utilization in Chile is on the upswing as well, hitting a high of 35% in early January before dipping down to 27%. Chile is a smaller market compared to Brazil, though still significant for the South America region with a daily average on-loan balance of around $1.7 billion over the past 12 months.
Graph 3: Chile fees to borrow
Trend 3: Asia remains hot despite fluctuations
Asian countries continue to be very profitable markets for securities lending participants. While overall fees for the region have dipped from their highs of 124 bps in April 2015 to 95 bps today, this is still much warmer than Europe (42 bps today) and North America (43 bps).
The hottest market in Asia today is South Korea, with fees recently hitting a high of 357 bps (see graph 4).
Graph 4: South Korea fees to borrow
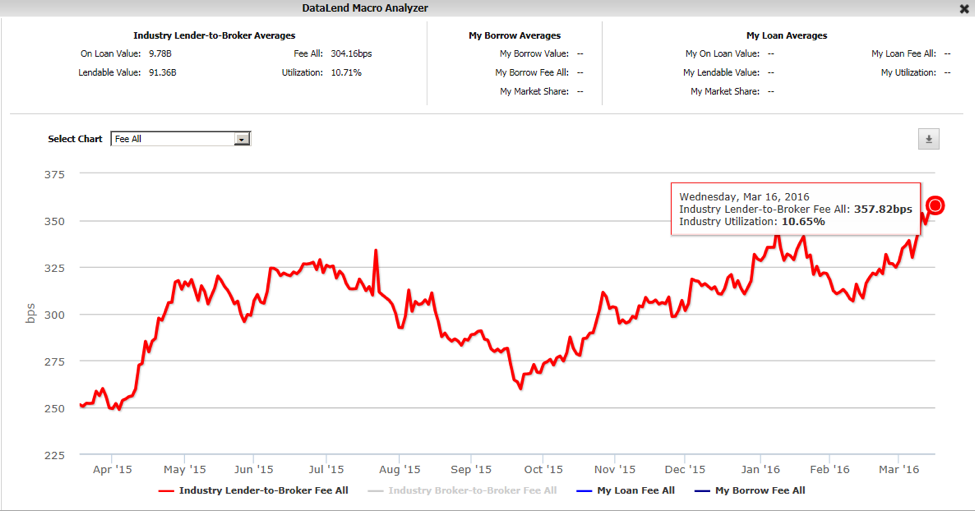
On-loan values for South Korea have vacillated over the past few months, but the 12-month average stands at $9.78 billion.
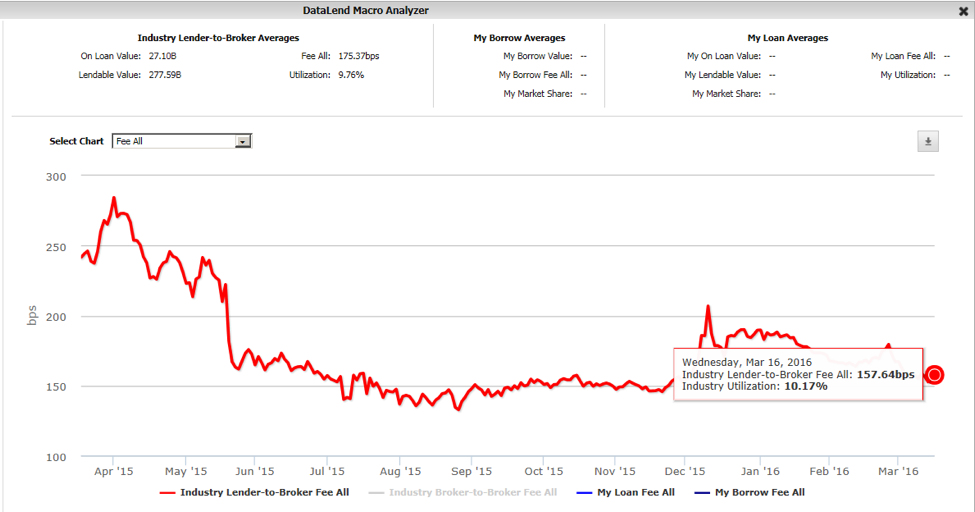
Meanwhile, in Hong Kong, fees to borrow have dipped over the past year from a high of 284 bps down to 157 bps today (graph 5). The primary driver of the cooling equities market in Hong Kong appears to be a significant decrease in fees to borrow Hong Kong information technology companies, from a high of 843 bps in April of last year down to just 71 bps today.
Graph 5: Hong Kong fees to borrow
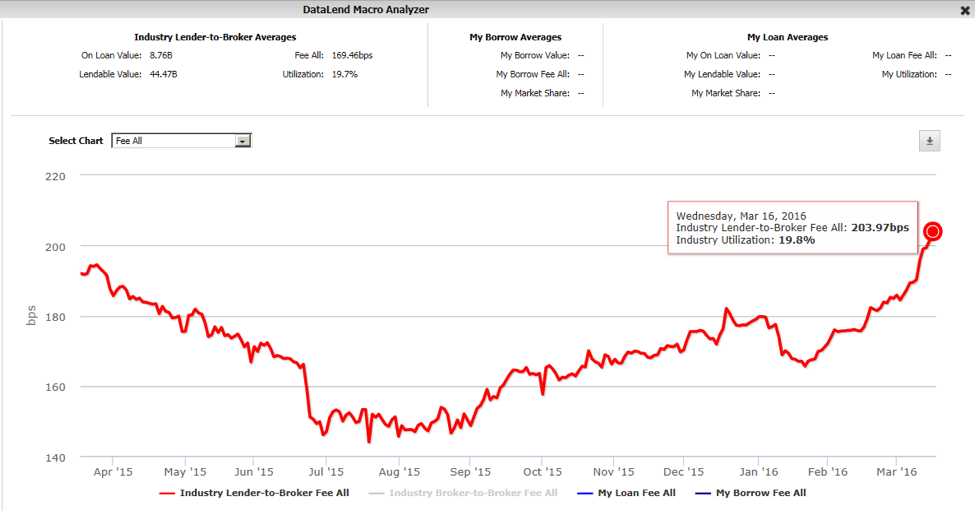
Elsewhere in Asia, fees to borrow Taiwanese securities appear to be on a recent upswing, from just under 150 bps last summer up to 203 bps today (graph 6). Utilization for Taiwanese securities is also high for the region at just under 20%.
Graph 6: Taiwan fees to borrow
Trend 4: Securities lending revenues pick up
Thus far, lender-to-broker securities lending revenues since the start of 2016 are ahead of the same timeframe last year. Revenues for Asia appear ahead by about 19%, with numbers coming in at $329 million thus far in 2016 versus $275 million during the same timeframe last year.
In EMEA, revenues appear to be up about 10% so far in 2016 from this time last year. Revenues from January 1 to March 18 came in just about $400 million in 2015 but have grown to $443 million for the same timeframe this year.
Finally, North America is also enjoying a securities lending revenue upswing thus far in 2016. Revenues from January 1 to March 18 2016 are up almost 20% from this time last year, from a gross of approximately $843 million to just over $1 billion.
There is a lot of uncertainty looming over the securities finance market in 2016. Broker-dealers are working hard to realize balance sheet efficiencies. Agent lenders are considering beneficial owner indemnification costs and alternatives. Regulations continue to cut into profit margins and require IT resources. But the increase in on-loan volumes, fees and revenues to date suggest that the securities lending market is not only weathering these uncertainties. In fact, it is thriving.