


On October 30th the FSB released “Global Shadow Banking Monitoring Report 2014”, their annual examination of the world of shadow banking. Shadow banking is described as “non-bank credit intermediate with bank-like systemic risks…includ[ing] maturity transformation, liquidity transformation, imperfect risk transfer, and leverage…” We take a look at the report.
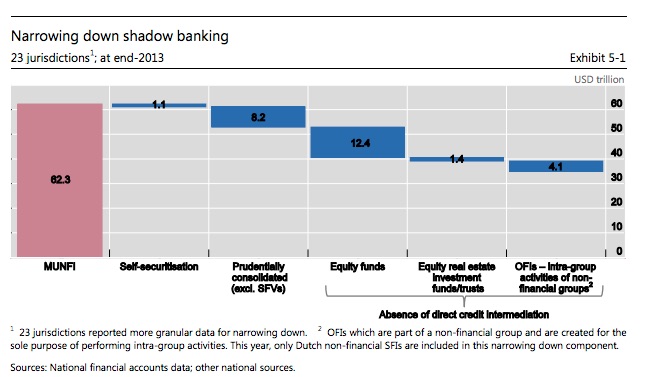
The press has grabbed onto the sound bite that shadow banking grew by $5 trillion in 2013, reaching $75 trillion. The FSB uses a metric referred to as Monitoring Universe of Non-Bank Financial Intermediation (MUNFI), but then also creates a “…narrower measure of shadow banking, which is constructed by filtering out non-bank financial activities that have no direct relation to credit intermediation (e.g. Equity Investment Funds) or that are already prudentially consolidated into banking groups…” After taking this over-counting into consideration, the shadow banking number comes in at $34.9 trillion, up from $34 trillion at the end of 2012. The latter metric seems better.
Where are shadow banking assets concentrated?
“…By absolute size, advanced economies remain the ones with the largest non-bank financial systems. Globally, MUNFI assets represent on average about 25% of total financial assets, roughly half of banking system assets, and 120% of GDP. These patterns have been relatively stable since 2008…”
The report noted that after accounting for exchange rate effect, MUNFI assets
“…grew by +7% in 2013, driven in part by a general increase in valuation of global financial markets, while in contrast total bank assets were relatively stable…”
and
“…The assets of Other Investment Funds, the largest MUNFI sub-sector..recorded close to 20% annual growth in 2013 – a sharp acceleration compared to their average growth over 2007-12 period. Money Market Funds and Broker Dealers’ financial assets rose by 3.0% and 1.6% in 2013, respectively…”
Interestingly enough, hedge funds, as a group, were undercounted in the report.
“…However, the size of the sector in the FSB’s exercise is significantly underestimated primarily due to two factors. First, off-shore financial centres, where most Hedge Funds are domiciled, are not included in the current scope of the exercise. Second, the Flow of Funds statistics are not granular enough in many jurisdictions to allow a separation between Hedge Funds and other sectors…”
The measurement of shadow banking has been a work in progress. Getting granular data across so many jurisdictions is difficult although major improvements have been made in the past few years.
The study looked at interconnectedness, probably the most important concern to the regulators. This is hard to measure and data is incomplete. Refinements in methodology “…resulted in significant downward revisions of the interconnectedness measures for a number of jurisdictions that were able to provide this extra granularity…”
“…This year’s results show that the level of interconnectedness exposures across jurisdictions declined on a year-on-year basis. Aggregated across jurisdictions, banks’ assets to OFIs [Other Financial Institutions] declined from $4.3 trillion at the end of 2012 to $3.9 trillion a year later, while banks’ liabilities to OFIs declined from $4.7 trillion to $4.4 trillion…”
It seems that as measurement methods are improved, the numbers are falling. Part of this, of course, is due to changes in the regulatory environment, risk management, and market changes. The question is “how much?
A striking graphic in the report compared banks & shadow banks and their contribution to systemic risk. There are two interesting things: 1.) In the Euro area and the UK, banks account for the lion’s share of systemic risk in the system and 2.) In the US, banks and shadow banks were about equal in their contribution, although banks were considerably lower than in the Euro area or the UK (and shadow banks higher). We wonder if this is driven by the respective size of the banking system in each area relative to GDP? 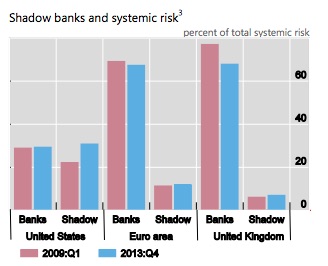 This report highlights the importance of shadow banking in the financial system and, as critical, the need to improve the measurement techniques used to monitor shadow banking. It does not paint the dire picture that is so often seen in the financial press but doesn’t minimize it either. After all, these numbers are in trillions with a “T”.