

Last week there was an interesting post in the New York Fed’s Liberty Street Economics blog. Entitled “What’s Your WAM? Taking Stock of Dealers’ Funding Durability” by Adam Copeland, Isaac Davis, and Ira Selig. The post took a look at liability management in tri-party for risk assets.
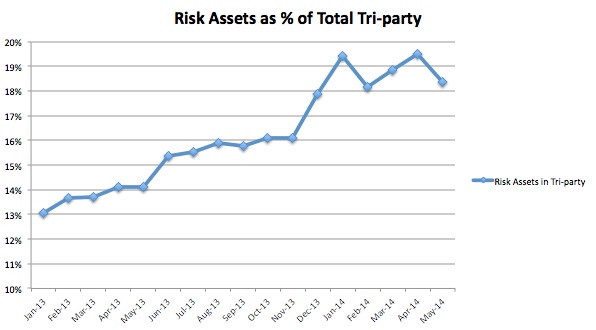
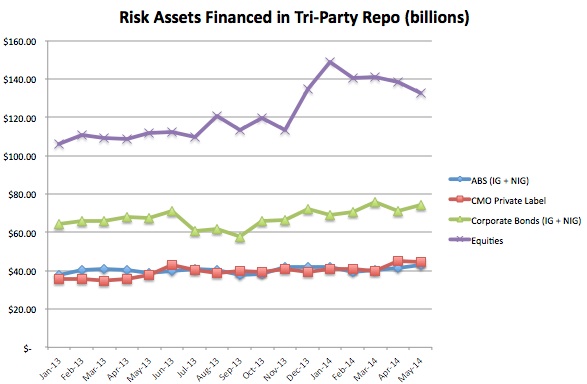
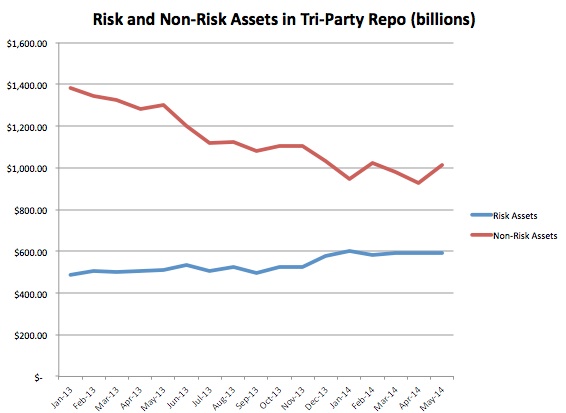
What are risk assets? For the purposes of the post, they are: asset-backed securities, private-label collateralized mortgage obligations, corporate bonds, and equities. As a percentage of total tri-party assets, they are small, although on a upward trend. From the start of 2013, when risk assets were 13% of total tri-party, they have risen to nearly 19% (as of May, 2014). While an increase in equities has been one driver of the change, it is more about the reduction in non-risk assets pushing the risk assets proportion higher.
Source: http://www.newyorkfed.org/banking/tpr_infr_reform_data.html
Source: http://www.newyorkfed.org/banking/tpr_infr_reform_data.html
Source: http://www.newyorkfed.org/banking/tpr_infr_reform_data.html
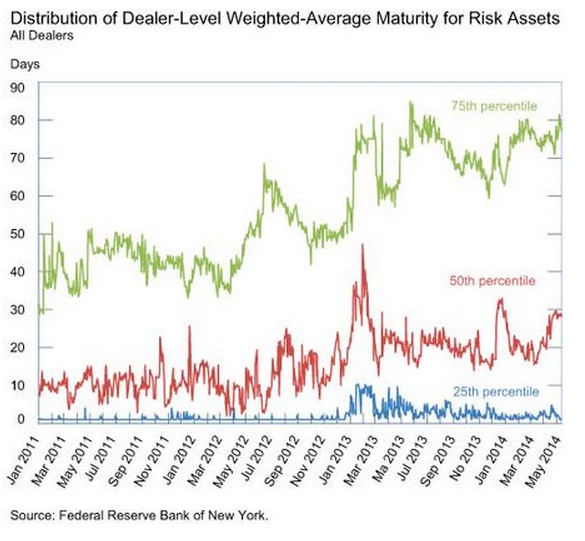
So what about the funding of the risk assets? The Fed observes that the Weighted Average Maturity (WAM) of the risk asset funding has lengthened. From the post:
“…We find substantial progress overall, with the weighted-average maturity (WAM) of funding of the less liquid securities more than doubling from January 2011 to May 2014. Nevertheless, there is currently a wide dispersion in dealer-level WAM, raising questions as to whether all dealers have enough durability in their funding of risk assets…”
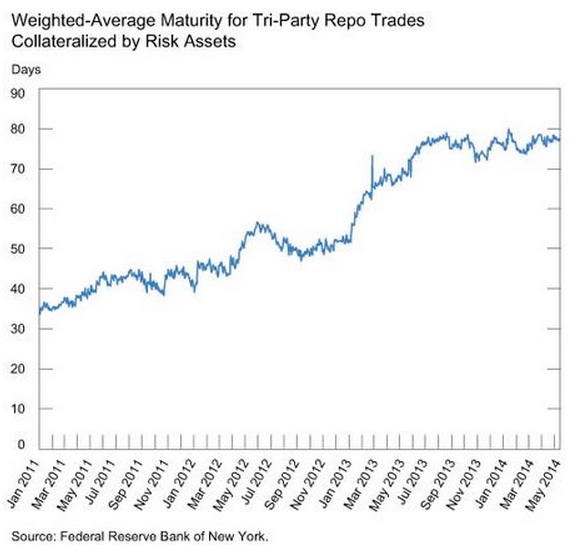
This is ceretainly positive news. SFM has been banging the drum that the Fed typically only talks about funding more liquid paper on tri-party. The research on fire sales has focused on solutions for liquid paper when the problem has never been in that sector. It is the less traded paper that is hard to sell and susceptible to fire sale prices in a forced liquidation.
If funding is longer for that paper – largely in part to LCR rules being followed, we suspect – it makes the market less prone to sudden liquidity events.
But the Fed said that the extending maturities are not across the board — some dealers have moved to lengthen maturities, other have not. Some dealers seem to be very conservative, with WAMs near 3 months. For others, it is business as usual with overnight (or very short dated) funding. With the Fed tracking this, we can be sure the more vulnerable dealers are being watched closely.
We would like to know more about how the funding numbers are collected. For example, do they include extendible funding trades and what is the assumed end date? Is there anything unique about the longer trades in terms of which assets they are funding? What about funding mis-matches? Are the dealers with the short funding profiles only lending cash short? (If so, then LCR hasn’t caught up with them….) Who are the cash lenders? We know that money funds are limited by maturity, so it must be that the Street has found other sources. What about the distribution and standard deviation of the borrowing data within the groups? For those with high WAMs, are there a couple very long deals pushing averages out? The devil is in the details.
At the end of the Finadium Repo conference on June 4th, we commented that while the repo community may not like the regulations or the costs, it has contributed to making the business safer and less prone to sudden shocks. If it is LCR pushing repo desks to lengthen out funding, then this is a good example of the regulations doing their job.