


The Systemic Risk Council recently came out with a “Systemic Risk Council Interactive Tool”, an interesting way to look at banks.
If you are not familiar with the SRC, it is:
“…a private sector, non-partisan body of former government officials and financial and legal experts committed to addressing regulatory and structural issues relating to systemic risk in the United States. It has been formed to provide a strong, independent voice for reforms that are necessary to protect the public from financial instability. The goal is to help ensure a financial system in which we can all have confidence…”
SFC is chaired by Sheila Blair, former FDIC head, and includes Paul Volcker, Brooklsley Born, Jeremy Grantham, John Reed, Alice Rivlin, and other major names from the finance, corporate, and regulatory community. These are heavy hitters who are impatient with the progress being made to tame the financial system.
You can compare institutions on several key metrics.
- Average Assets
- Average Assets as a Percent of GDP
- Tier 1 Leverage Ratio
- Tier I Risk Based Capital Ratio
- Total Risk Based Capital
- Market Value of Equity to Market Value plus Book Value of Debt
- Short Term Noncore Funding as a Percent of Total Assets
The time frame goes from 2000:Q4 to 2014:Q3.
It shouldn’t be a surprise that one of our favorites is Short Term Noncore Funding as a Percent of Total Assets. This speaks to the use of market-based funding, presumably including securities financing. It is interesting to see this over time for specific financials. You can choose 3 institutions to compare. Below are Bank of America (orangy-red), Citi (yellow), and JP Morgan (teal).
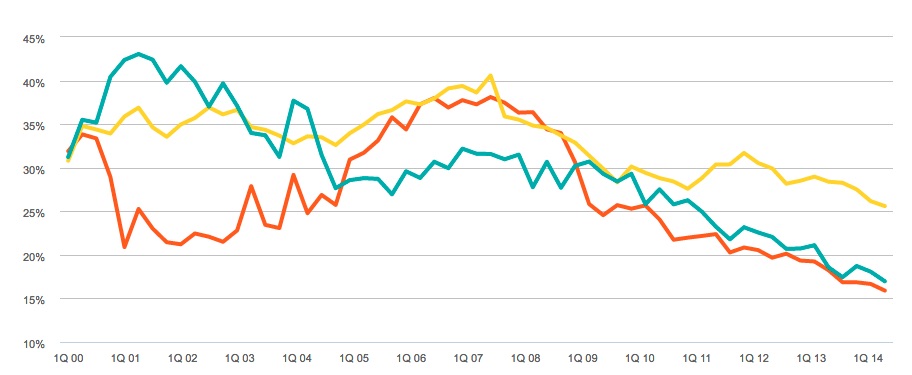 Source: SNL Financial
We also looked at a comparison between JP Morgan (teal), Wells Fargo (purple) and GE Capital (olive). GE Capital, with its short life as a SIFI doesn’t have much of a published history (and it will probably be leaving that club soon — more on that later this week). The comparison explains the advantageous position that Wells is in and, perhaps, why they have some headroom to grow their securities financing/prime brokerage businesses. The levels for GE Capital – pretty much tracking JP Morgan – may say a lot about why they received their SIFI designation in the first place.
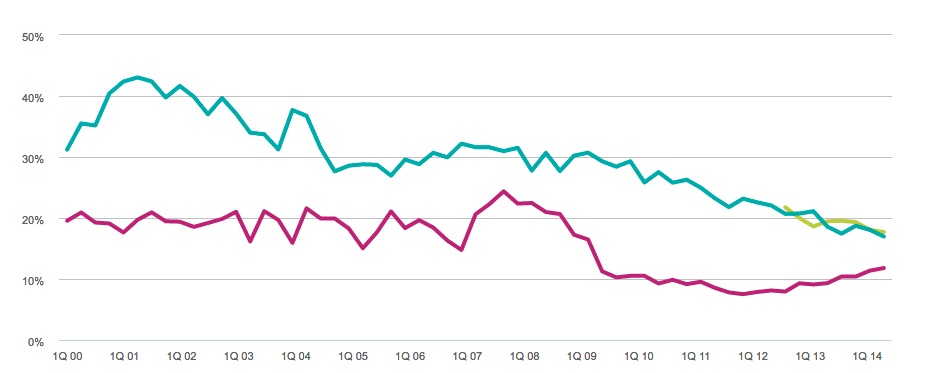
Source: SNL Financial
Finally we look at a comparison of Short Term Noncore Funding across the universe of tracked banks for 2014:Q3.
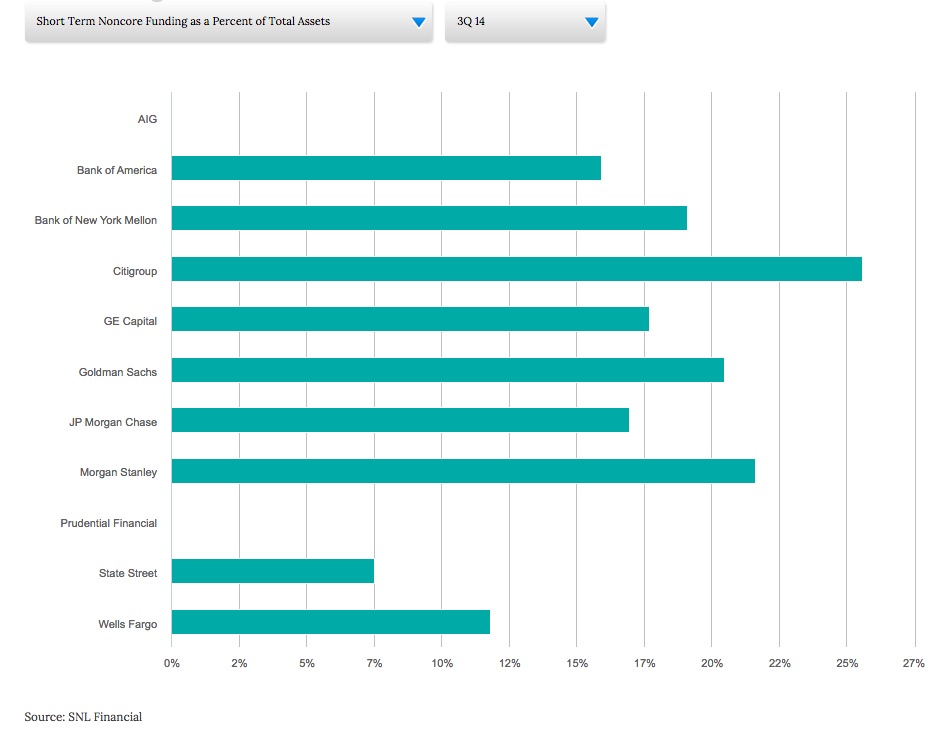
It looks like a couple institutions have some work to do.