

We recently undertook a study of US bank SEC filings to learn if anything could be said about how efficient banks are with their in-house collateral. Our thesis was that as collateral becomes more important to financial markets, the banks that were already showing the greatest amount of collateral efficiency would be the biggest winners. Here’s what we found out.
Methodology: we wanted to learn if banks were making money on collateralized activities for the “house” – collateral positions living in Treasury. We defined collateral efficiency as the revenues generated by collateralized financing activities. We did not attempt to review collateral at the business level and thought it would be all but impossible to do so anyhow.
We looked at the quarterly financials of six banks: Bank of America, Citi, Goldman Sachs, JP Morgan, Morgan Stanley and Wells Fargo. Of the six, all report a figure of Net Cash Provided by Financing in their Consolidated Statement of Cash Flows; this is where we hoped to find any revenue information at all related to collateral. The banks were not consistent about how they reported the data. Some broke out proceeds vs. payments, others disclosed short term financing and still others had a vague “other” section included. Most of the banks broke out repo.
For every bank, the overall category of Net Cash Provided by Financing is a non-starter for evaluating collateral. The category includes dividends paid, stock acquired or tendered, issuance of long-term debt and other activities. Its a very broad catch-all and not relevant for our purposes. Only the subsections were worth considering.
For Morgan Stanley, we think there are a few lines in their filings that speak to collateral efficiency. The years in the chart below, from left to right, are 2014, 2013 and 2012, in US$ millions. Of the six banks, only Morgan Stanley disclosed proceeds and payments for derivatives financing activity as well as another category for other secured financings, which may or may not be repo. (Morgan Stanley and others provide gross repo and reverse repo amounts in the notes. This gives net exposure but says nothing about revenues or efficiency.) The category of “commercial paper and other short-term borrowings” is also of interest, especially given the rise in cash generated over the three year period.
Morgan Stanley:
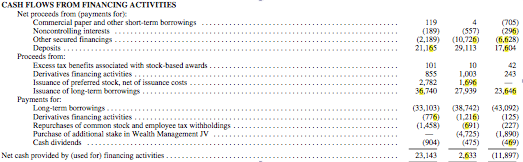
Source: Morgan Stanley 10K 2014
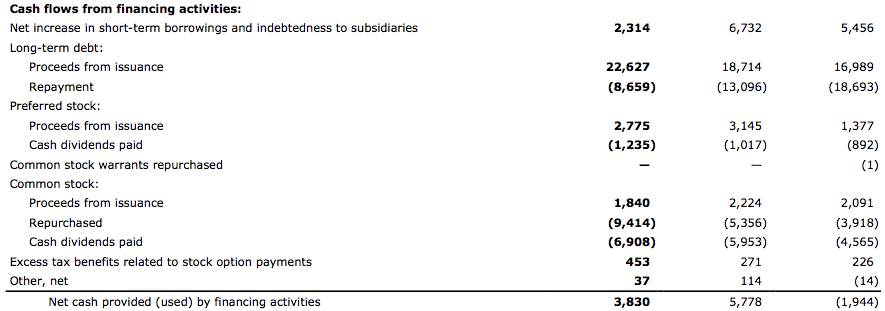
Other banks are less forthcoming, partly we think because there are so many subsidiaries in a Bank Holding Company that collateral efficiency may happen further down the chain of financial reporting and never make it to annual report. Here’s Wells Fargo’s Cash Flows from Financing. Again, left to right, the years are 2014, 2013 and 2012, in US$ millions.
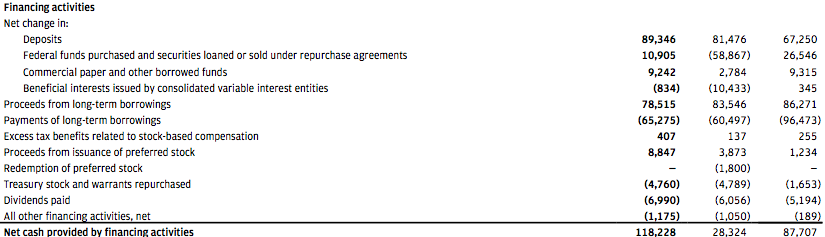
Lastly, to test our idea we checked out J.P. Morgan to see if the London Whale revenues were accounted for here and how it might show up. The data below are, from left to right, 2013, 2012 and 2011, in US$ millions. Check out the drop in 2012 revenues due to repo.
Our takeaways here are that collateral efficiency is hinted at in the cash flows from financing activities but its not clear enough yet to make a determination that Bank A is more efficient than Bank B. We would expect over time however that collateral efficiency will show up in the data. We think its worth keeping an eye on the financing activities sections in financials to see what shows up.