

An article that appeared on May 29th in the FT “Big Investors replace banks in $4.2tn repo market” by Tracy Alloway caused a bit of a stir. Some good reporting on trends in repo, but the numbers were off. The article, which is behind a paywall, said that “What remains of the $4.2tn market is increasingly being taken up by non-bank entities such as real estate investment trusts (Reits), mutual funds and hedge funds.” Looking specifically at REITs, the article noted, “The growing use of repo has been particularly marked among Reits, which have overtaken banks and broker-dealers as the largest borrowers in the market, according to Federal Reserve data. To purchase long-term mortgage assets, Reits have increased their repo borrowings to $281bn, up from $90.4bn in 2009.” To be honest, that sounded off to us. REITs have had an enormous deleveraging recently, prompted in large part by the QE taper scare last year. Annaly, the 10,000 pound gorilla in the market, shrank their mortgage-backed securities holdings 41% from $115.22 billion at the end of 2012 to $68.144 billion at the end of 2013. From 2010 to 2013 there was a decline of about $7 billion.
2010 $75.012 billion
2011 $97.963 billion
2012 $115.220 billion
2013 $68.114 billionSource: Annaly Annual Reports
Alloway looked to Fed as proof of the REITs repo borrowing, using Flow of Funds data (table L.207). The data for REITs looks like this: 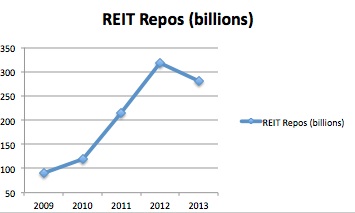 Source: http://www.federalreserve.gov/releases/z1/current/accessible/l207.htm
The Fed Flow of Funds data shows a $160.5 billion increase in REIT repo between 2010 and 2013 (from $120.5 billion to $281 billion). Totally inconsistent with bell weather REIT Annaly. A REITs repo is a dealers reverse, with the (vast?) majority of the paper being financed (by the dealers) in tri-party. Remember, repo is a closed ecosystem. So if we look at the paper that REITs buy and finance in tri-party, the pattern should be the same as the Flow of Funds data. It is not.
Adding together the tri-party repo numbers for the assets that REITs primarily invest in (Private Label CMOs, Agency MBS and Agency CMOs) we see that these totals are about unchanged from 2010 levels, although it took a big spike upward in 2012 and then fell sharply (consistent with Annaly’s portfolio behavior and QE taking paper out of the market). 2009 tri-party isn’t available. The Fed Flow of Funds data and the Fed’s tri-party data seem to contradict each other. Tri-party says the market for typical REIT paper financing is unchanged from 2010 to 2013, the Flow of Funds numbers say it is up massively. We trust the Fed’s tri-party data collection more. 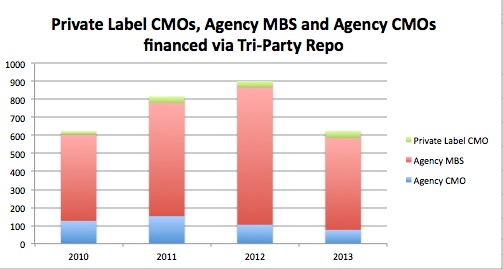 Source: http://www.newyorkfed.org/banking/tpr_infr_reform_data.html
The other thing that caught our eye in the FT article was the assertion that REIT repo is now bigger than broker-dealer repo ($281 billion vs. $135.3 billion in 2013). The REITs finance almost all their paper with dealers – so all those deals show up on the banks balance sheets. The Fed Flows of Funds Data isn’t what it seems.
The chart label on the Flow of Funds key is
“Security brokers and dealers; security repurchase agreements (net); liability”.
We are going to assume that this line item isn’t just the non-bank securities dealers, but includes bank and non-bank dealers alike. But still, something seems wrong. We think the key word here is “net”. This means the number is the difference between a dealer’s reverses and repos. It makes sense that repos, which create a liability, exceed reverses since banks finance their house positions (otherwise the net flow of funds number should be close to zero — that is why they call repo businesses a “matched book”). That figure in 2013 was $135.3 billion. But the author makes it sound like the $135.3 billion is the dealer’s portion of the $4.2 trillion repo market. It is like saying a restaurant buys $1,000 of food, sells $975 of it and that the $25 left over is a good metric for how much business the place did. It doesn’t really work like that.