

The New York Fed, in their Liberty Street Economics blog, has started a series on the System Open Market Operations (SOMA) portfolio. The first post, which came out on August 12th was something of a history lesson, but one worth looking at. It was entitled “The SOMA Portfolio through Time“. The second post was called “A History of SOMA Income”. We take a look at some interesting bits.
The Treasury-Federal Reserve Accord of 1951 “…gave the FOMC the exclusive ability to set monetary policy without influence from the Treasury…”. This ushered in an era of managing bank reserves and saw increased use of repos “to change the level of bank reserves rather than conducting permanent open market operations. While the size remained steady, the composition of the portfolio shifted back toward shorter-term, liquid instruments…”
“…In the early 1960s, the composition of the portfolio shifted again toward longer-term securities under the original Operation Twist, a program aimed at lowering long-term interest rates without affecting the level of short-term rates (see Alon and Swanson [2011]) as a way to foster capital investment and economic growth without exacerbating the gold flows out of the United States that were occurring at that time. To execute Operation Twist, the Desk sold $9 billion (approximately $69 billion in 2012 dollars and 30 percent of the SOMA portfolio in 1961) of shorter-term Treasury certificates and purchased an equivalent amount of longer-dated Treasury coupons…”
Who knew there was precedent for managing the yield curve this way?
“…From the 1970s until the onset of the financial crisis, the operating procedures for the SOMA portfolio were to target reserves consistent with the FOMC’s desired value of some intermediate target variable: Usually the fed funds rate, but during the late 1970s and early 1980s the growth rates of monetary aggregates…”
“…The Fed’s response to the financial crisis that started in 2007 had large effects on the balance sheet. Initially, the provision of liquidity through facilities such as the Term Auction Facility and through central bank liquidity swaps was offset through reductions in the SOMA’s securities holdings in order to maintain a steady balance sheet size and level of bank reserves. By the end of 2008, the domestic securities portfolio fell from approximately $750 billion to $500 billion, although the WAM increased significantly, to 6.8 years, because the size reduction occurred primarily through redemptions and sales of short-term securities…”
And now the juicy stuff:
“…However, with the fed funds target lowered to the zero lower bound in December 2008, further scope to use the normal policy tool of reducing short-term rates didn’t exist. For this reason, the FOMC began to use the SOMA portfolio more actively as a direct tool of monetary policy, purchasing longer-term assets as a means to reduce private sector holdings of such assets and thus reduce term premia and long-term interest rates (see Gagnon et al. [2010])..” This is when we saw extraordinary expansion of the Fed’s portfolio.
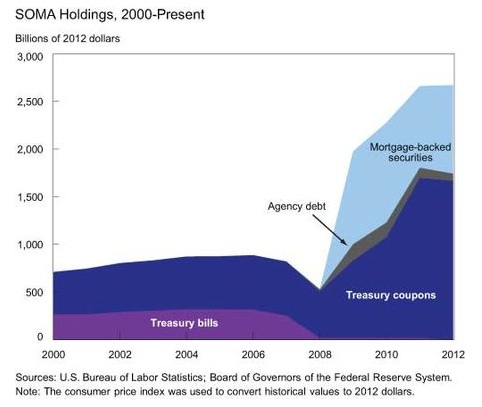
The asset mix in the SOMA has changed considerably since the financial crisis, most notably in Treasury Coupons and MBS. Between 2008 and 2012 the portoflio chaged:
Treasury Bills $19 bio to <$1 bio
Treasury Coupons $487 bio to $1,666 bio
Agency Debt $21 bio to $76 bio
MBS <$1 bio to $926 bio
(We left out Treasury Certificates and Bankers Acceptances, both of which were less than $1 bio in both years…and because we are not really sure what a Treasury Certificate is.)
==========================
The second post, which came out Sept. 13th was “A History of SOMA Income”
The post noted that operating a money making portfolio really isn’t an objective for the Fed, but rather, “…Net income is a byproduct of actions taken to pursue the economic objectives given to the Federal Reserve by Congress…” But, as the chart below shows, it did make a lot of money.
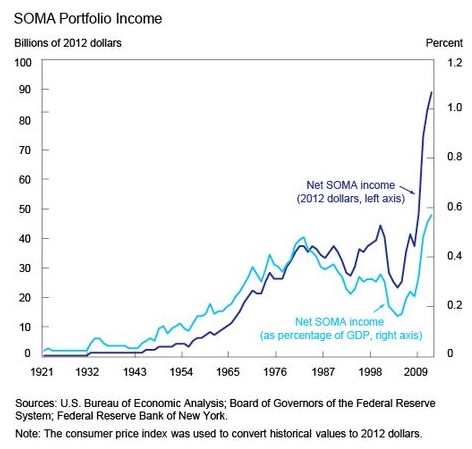
The Fed has always reported profits on their portfolio. SOMA income was generated by the spread of securities owned versus currency on their balance sheet…and the Fed paid no interest on the currency. On top of that, the Fed uses amortized cost accounting and doesn’t mark to market. But the profitability of the portfolio was certainly not a given “…since realized losses (or gains) on the portfolio are included in net income calculations, income would be negative if the SOMA incurred large-enough realized losses to offset the interest income. But given that asset sales have been historically small, this has never occurred…”
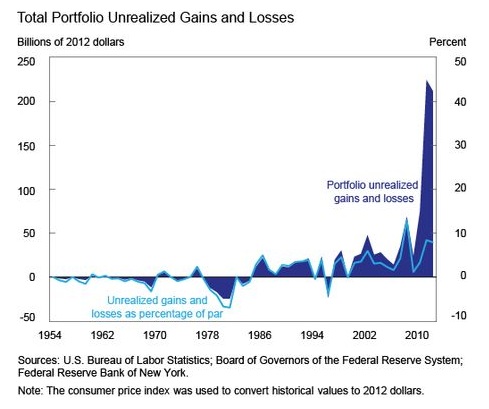
In the Volcker-era days of 20% short-term interest rates, the Fed did suffer mark to market losses on their portfolio. In recent months, market volatility has put a dent in the portfolios unrealized losses and gains, but has not come close to pushing it toward a cash loss.
A chart showing mark-to-market on the SOMA portfolio is below.
The Fed has financed their most recent balance sheet expansion with interest-bearing reserves. We have written about the Fed policy on Interest on Excess Reserves (IOER) from time to time, often wondering if taking the rate to below what banks could earn in the market (which is pretty much on top of zero) would push behavior more toward consumption over holding cash. But that is a different story.
The post took great care to say that the portfolio profits are not a lock. “…Looking ahead, as interest rates rise during a period of normalization of the stance of monetary policy, the market value of the portfolio is likely to fall, and it is possible that this could result in unrealized losses on the SOMA portfolio. Nevertheless, even if these unrealized losses are large, they will only affect income if and when assets are sold from the portfolio.
And
“…As interest rates will likely rise in the future, income is expected to decline for a while from the current levels…”
Certainly when the Fed eventually tapers their purchases, which in turn signals higher interest rates, there could easily be mark to market losses, perhaps even actual cash losses. If the Fed is using IOER to finance their portfolio and higher market rates pull that cash toward other uses, could the Fed could end up in a bit of an asset/liability squeeze? That’s a lot of paper to finance.
A link to the “The SOMA Portfolio through Time” post is here.
A link to the “A History of SOMA Income” is here.