

The Office of Financial Research (OFR) published on February 12, 2015 “Systemic Importance Indicators for 33 U.S. Bank Holding Companies: An Overview of Recent Data“ by Meraj Allahrakha, Paul Glasserman, and H. Peyton Young, an interesting look at how individual banks score on systemic risk. This is the second of a two part post.
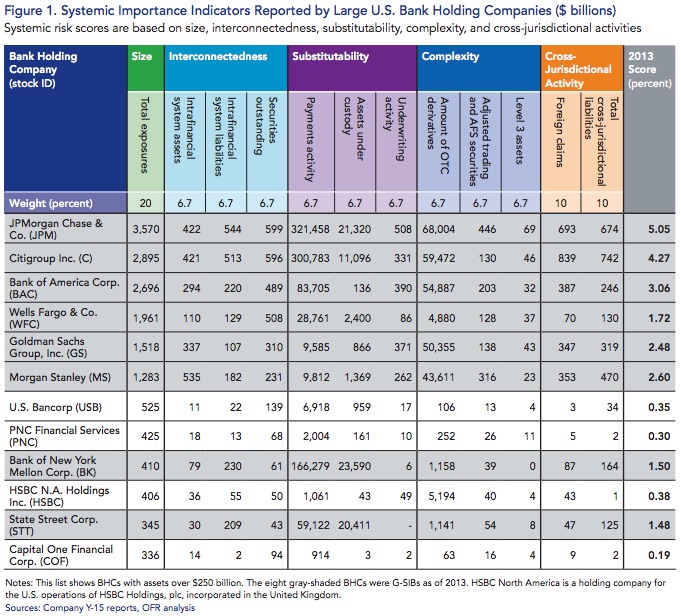
So which banks found themselves high up on the list? JP Morgan (score: 5.05), Citi (score: 4.27), BofA (score: 3.06), Morgan Stanley (score: 2.60) and Goldman Sachs (score: 2.48) rounded out the top 5. These 5 scored high on interconnectedness (one of the 5 areas examined by the OFR) versus their competition. For example, on intrafinancial system assets (a component of interconnectedness), their scores ranged from 294 to 535. The next highest, Wells Fargo was 110 and the lowest, CapitalOne, came in at 14. Same thing for complexity. The top 5 averaged 55,265 on the Amount of OTC derivatives component. Next highest was HSBC at 5,194.
In Substitutability, probably the least intuitive component, the results were a bit different. Substitutability is about businesses like custody, payments, and underwriting. The question is: how much to their clients depend on these institutions to provide these services? If a bank drops out of these businesses, will they be leaving their customers high and dry? BNY Mellon, JP Morgan, and State Street grabbed the top 3 slots. Citi came in 4th at about half the numbers posted by the top 3.
Overall the banks were divided into 3 buckets: the top 5 with an average score of 3.49. The next tier, Wells Fargo, State Street and BNY Mellon, with an average score of 1.57. Then the bottom of the list – US Bancorp, PNC, HSBC and CapOne – registered an average 0.31 score. Wells seemed to have more in common with the top 5, only scaled down. State Street and BNY Mellon scores were hiked up by their major infrastructure businesses: custody and payments. The smaller guys were minor players in the categories tracked by the FSB, perhaps with the exception of HSBC’s OTC derivatives on the books (which came in slightly ahead of Wells Fargo).
Scores were normalized as per the Basel Committee rules. From the report:
“…For example, if a bank has a value of $4 billion for one indicator and the group’s total value for that indicator is $100 billion, the bank’s score for the indicator is 4 percent. This approach puts the scores for different indicators on a common scale. The normalized scores for indicators were averaged within each category to produce a subscore. The five category subscores were then averaged to produce an overall score…”
Substitutability, however, was capped at 5%. Otherwise, the high concentration and scale in this business segment would have skewed scores too much, pushing up JPM, BNY Mellon, and State Street.
The report did mention securities financing a couple times. The most interesting quote was:
“…Some dimensions of systemic importance are not captured by the indicators. One is the extent to which a bank engages in maturity and liquidity transformation. Funding long-term illiquid assets with short-term liabilities can make a bank resolution more difficult…”
We wish there were better publically available indicators for securities financing. The regulators spend a lot of time talking about the risks, but less effort is placed on reporting. We recognize it is a difficult task and currently on the radar screen, but it has been taking too long.
The report went into detail on comparing G-SIB results to the universe of banks the OFR analyzed. It is too much to delve into it on a short post, but we recommend reading the entire article for those interested.
Finally, from the report:
The overall conclusions from the report were:
- The largest U.S. banks generally scored highest for all systemic risk indicators, but had relatively low Tier 1 leverage ratios compared to smaller banks.
- Several of the largest banks scored high in systemic importance because they dominate specific businesses, such as payments and asset custody services. Others scored high in complexity because of their trading and derivatives businesses.
- Seven of the eight U.S. G-SIBs had high values under the OFR’s connectivity index, introduced in an earlier OFR working paper.
- Basel Committee-recommended capital buffers would still leave U.S. G-SIBs with generally lower capital ratios than other large U.S. banks.