

Data provider RavenPack’s latest white paper looks at the impact of news sentiment, either as standalone or enhancing factor, and its application to quantitative investment strategies (QIS) for Asia Pacific equities. Researchers found that news sentiment as a factor, in general, provides a robust source of medium-term alpha for the Asia-Pacific region.
In a two-part study, the data science team tested how sentiment performed as a factor on its own and then as a value add input to a traditional multifactor model by constructing a Sentiment Index with variable smoothing periods that showed promising results when applied to a long-short, market, and factor neutralized APAC equities portfolio.
The sentiment factor APAC index shows promising performance when used as a standalone strategy. Not only is it uncorrelated with the most common traditional factors, but it also delivers robust positive performance over time. Consistent with the well-known fact that news information signals are typically fast, the team observed a performance improvement when increasing the rebalancing frequency – however, this also results in an increase in the strategy turnover.
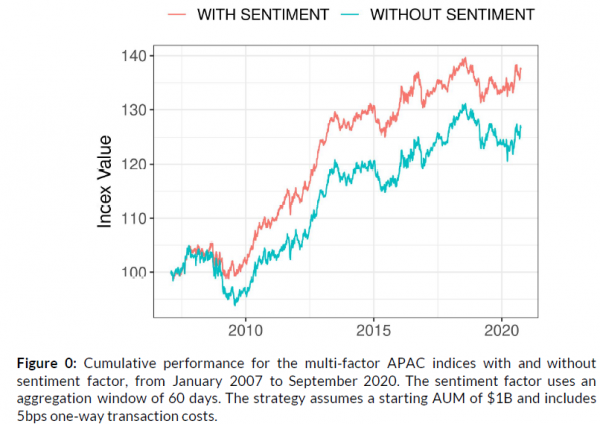
In one use-case, the sentiment aggregation window of 60 days was a robust optimal choice for all of the scenarios taken into consideration. With monthly rebalancing frequency, this aggregation window delivers an IR above 0.7 and an Annualized Return above 400bps for an AUM of $1 billion, with an Annualized Turnover under 1500%.
When RavenPack’s researchers incorporate the sentiment factor into a traditional multi-factor framework for the Asian markets, consisting of Momentum, Low Size, Low Volatility, Growth, Value and Quality factors, the performance improves significantly. For the $1 billion AUM strategy with a monthly rebalancing frequency, the IR increases 64%, from 0.45 to 0.74, and the Annualized Return increases 35%, from 167bps to 225bps. The turnover remains fairly low at around 500%, while the average portfolio size is slightly larger, at over 850 names, which represents almost all of the companies included in the benchmark index.