


The Wall of Cash held by US money market funds is a potential source of US Treasury repo disruption if investor sales happen fast. A quick disappearance of cash providers could lead to sudden changes to rates and volumes, creating volatility for not just repo but also underlying US Treasury markets and the basis trade. The recent US tax deadline supports a projection of how this might play out in real time.
Money market funds are a mainstay of US repo markets, providing the cash that supports dealers to finance both their own activities and their hedge fund clients. In a best case scenario, matched book trades take in cash from money funds and lend it onwards to hedge funds with a dealer providing credit intermediation to both sides. Dealers have been highly successful at keeping both sides of this trade in equilibrium, but occasional periods of disruption, notably a sharp reduction in cash in September 2019, have caused outsized volatility.
If the market wants to know what volatility in 2024 looks like, cash exiting the market on March 15 as taxes were due provides a snapshot. The rise in rates that occurred as a result provides a preview of what a bigger cash reduction could look like, considering new factors like the Federal Reserve’s Standing Repo Facility. 2024 is not 2019, but as interest rates fall and money market funds become less attractive for investors, market participants can have an idea what will happen to pricing in real-time. These figures can be quantified using data from DTCC Data Services’s Treasury Kinetics data service, the DTCC GCF Repo Index®and sponsored repo information.
What is the Wall of Cash?
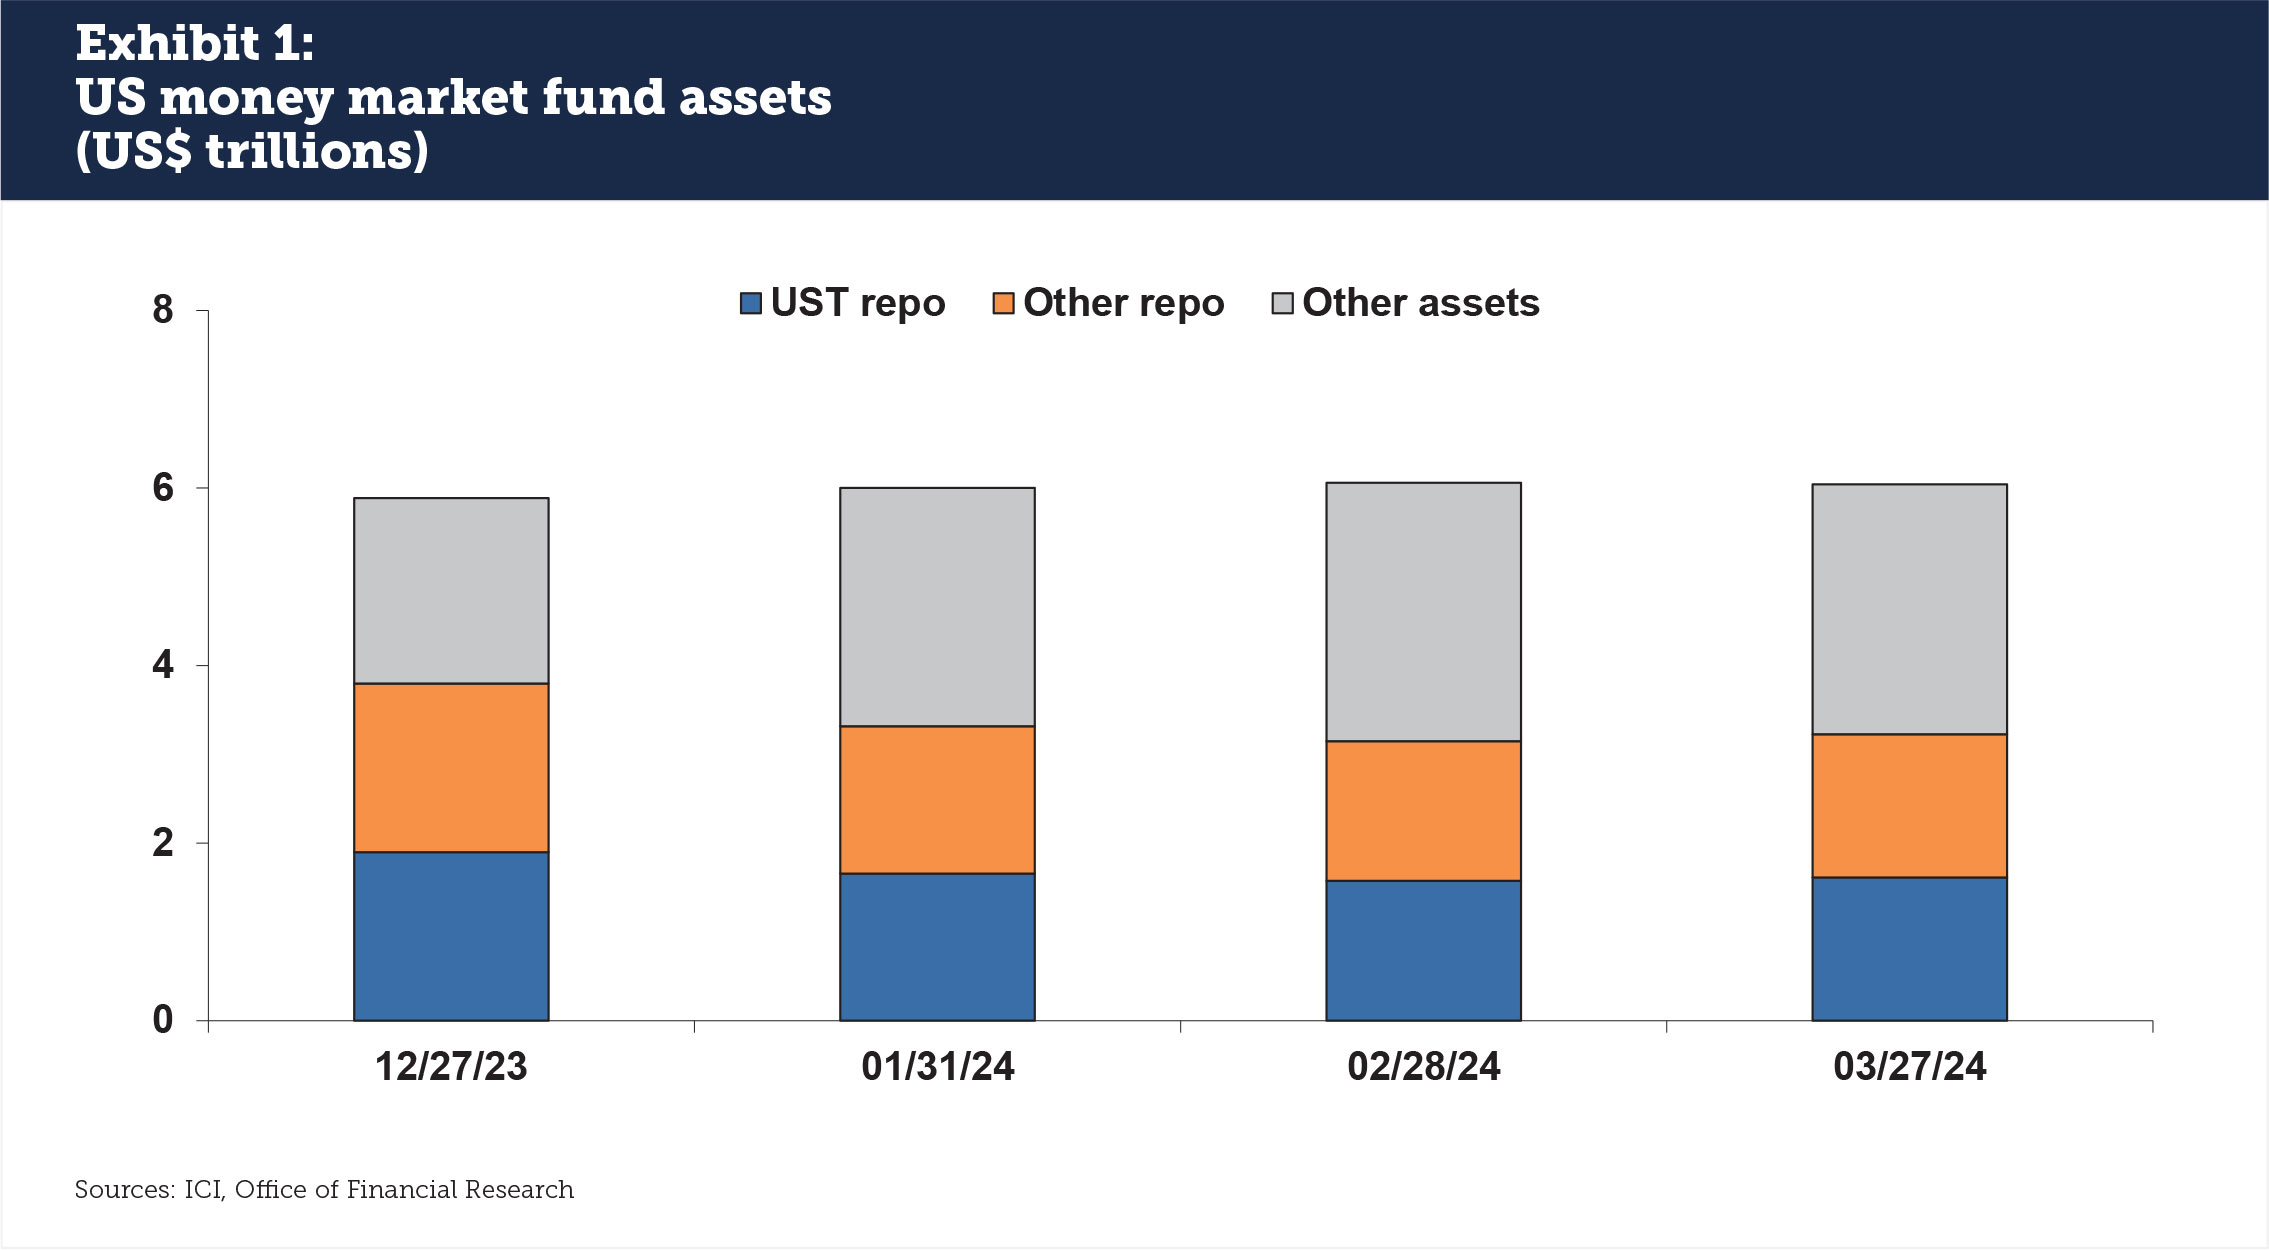
US money market funds hold around US$6 trillion in assets, according to the Investment Company Institute (ICI) (see Exhibit 1). The Wall Street Journal has referred to this as the “Wall of Cash,” speculating on when it will break and money will flow into the stock markets.
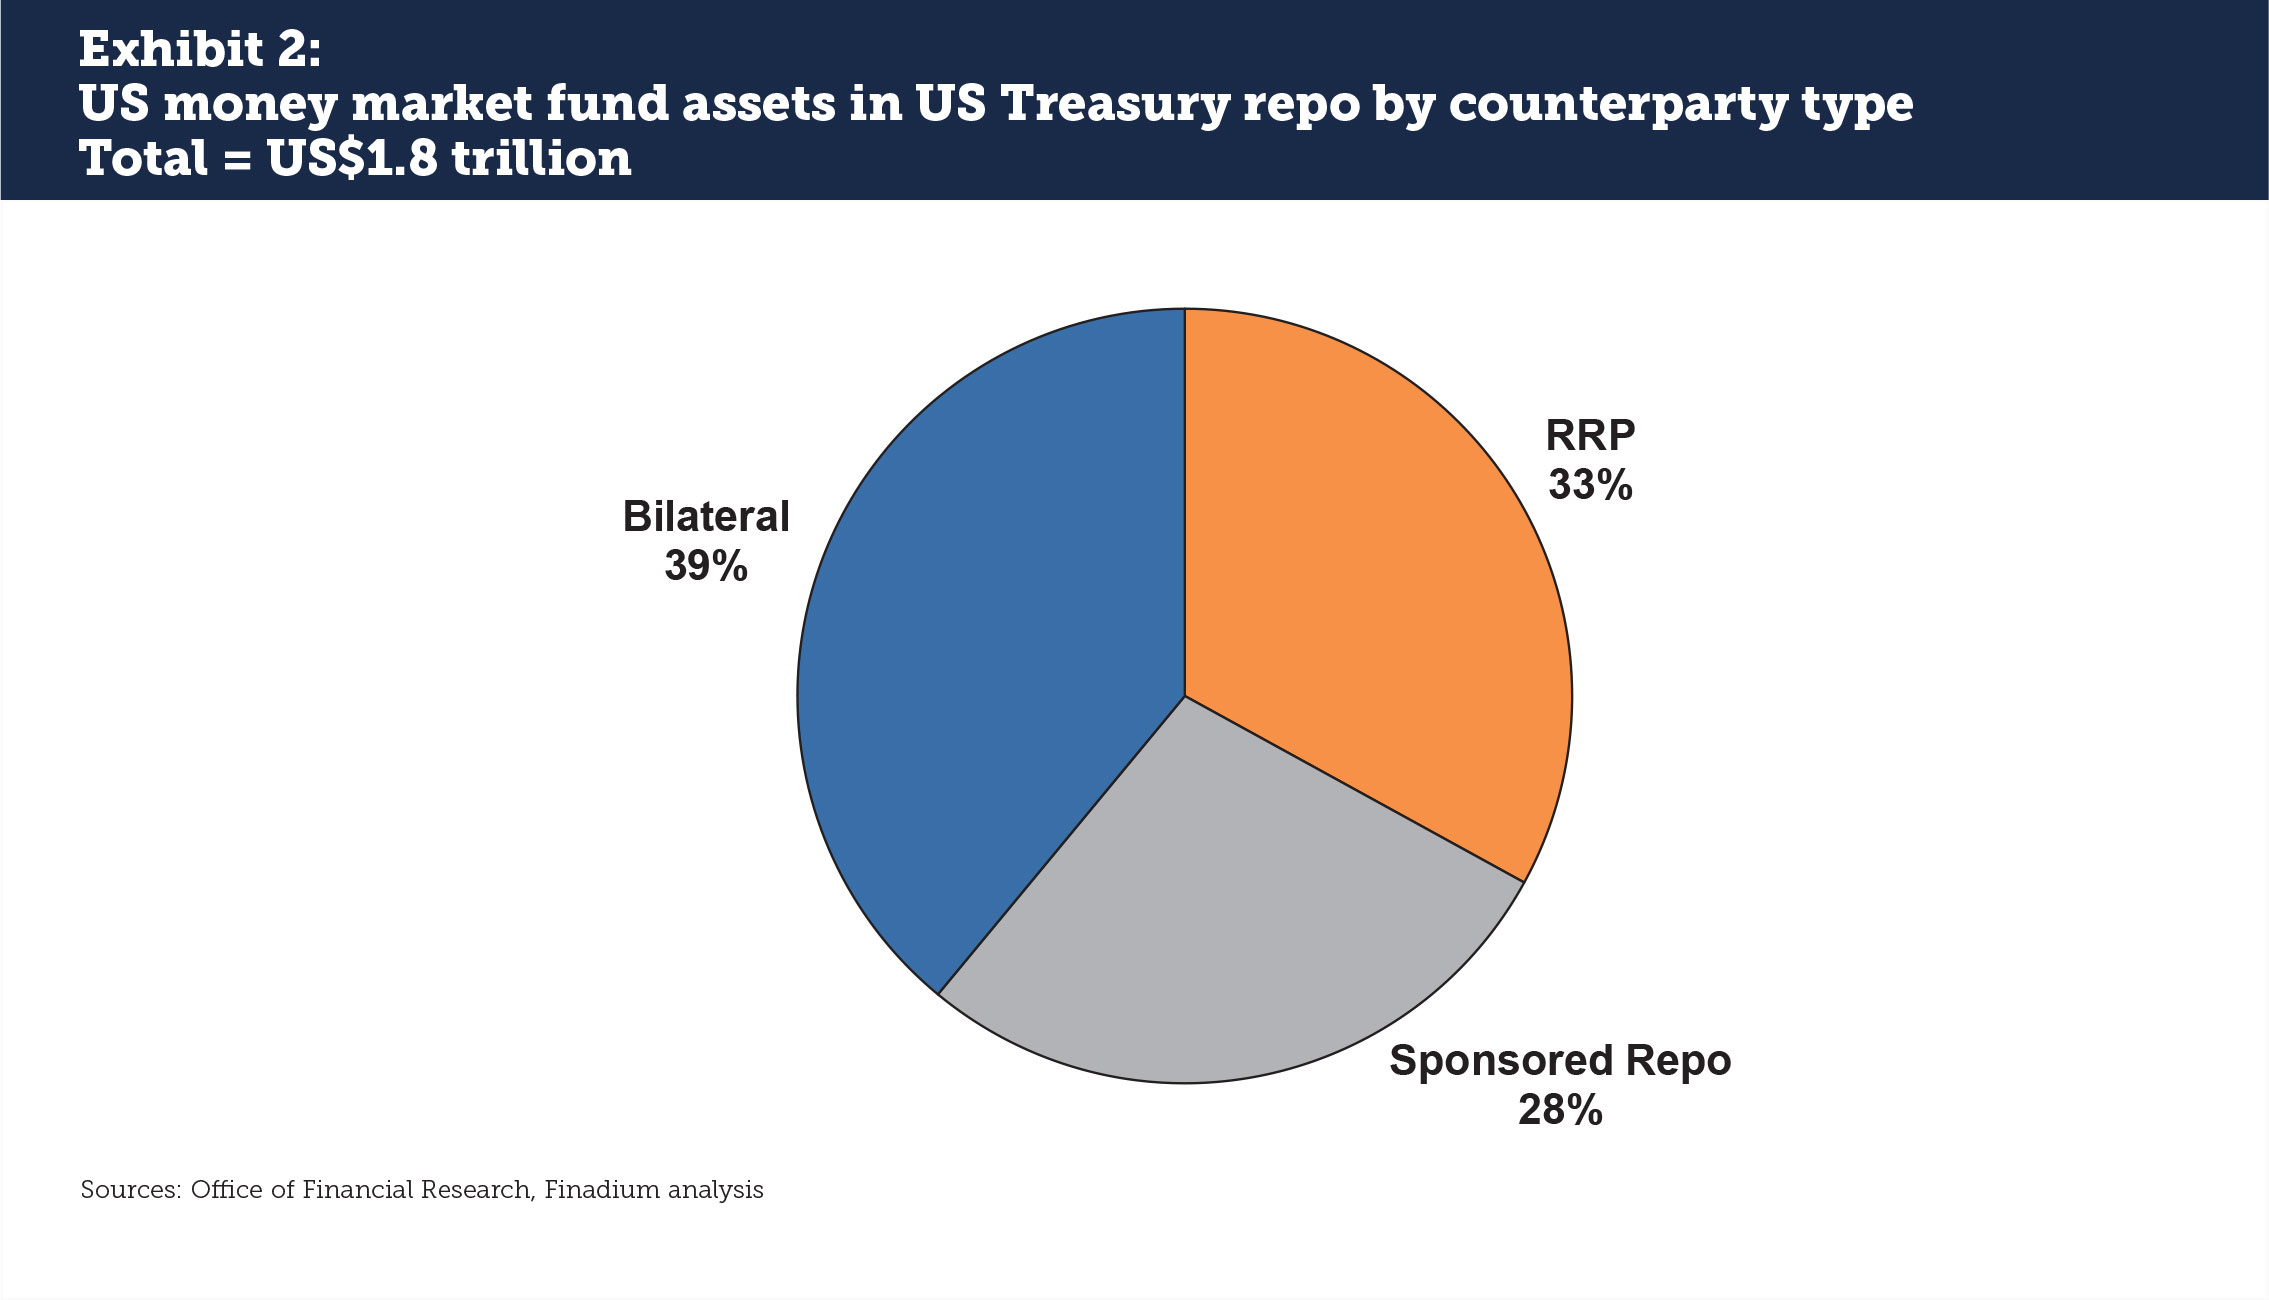
The US Office of Financial Research reports that US Treasury (UST) repo accounts for $1.8 trillion of money fund assets, and that one-third of that cash is invested at the Federal Reserve’s Reverse Repo Facility (RRP) (see Exhibit 2). This is much less than the 90% invested at the RRP just a year and a half ago. The remainder of UST repo investments are split between FICC Sponsored Repo (28%) and a mix of bilateral counterparties (39%). Combining centrally cleared and bilateral repo, over $1 trillion of money market fund assets has been placed with UST repo dealers for investment purposes.
Tax Season
Prior to the March 15, 2024 tax deadline, there was thinking that a withdrawal of cash could lead to higher funding rates for banks and hedge fund clients that in turn could trigger excess volatility. September 2019 and March 2020 remain on the minds of regulators: even a small potential for volatility is enough to cause concerns that liquidity in the Treasury market could be disrupted, especially by large basis traders with no need to hold their positions if revenues are unattractive.
This idea has extended throughout the official sector: a recent International Monetary Fund (IMF) financial stability report noted that “a concentration of vulnerability has built up, as a handful of highly leveraged funds account for most of the short positions in Treasury futures. Some of these funds may have become systemically important to the Treasury and repo markets, and stresses they face could affect the broader financial system.” As US Treasury issuance has grown, anything that could possibly disrupt equilibrium in the US financing markets is now worth watching closely.
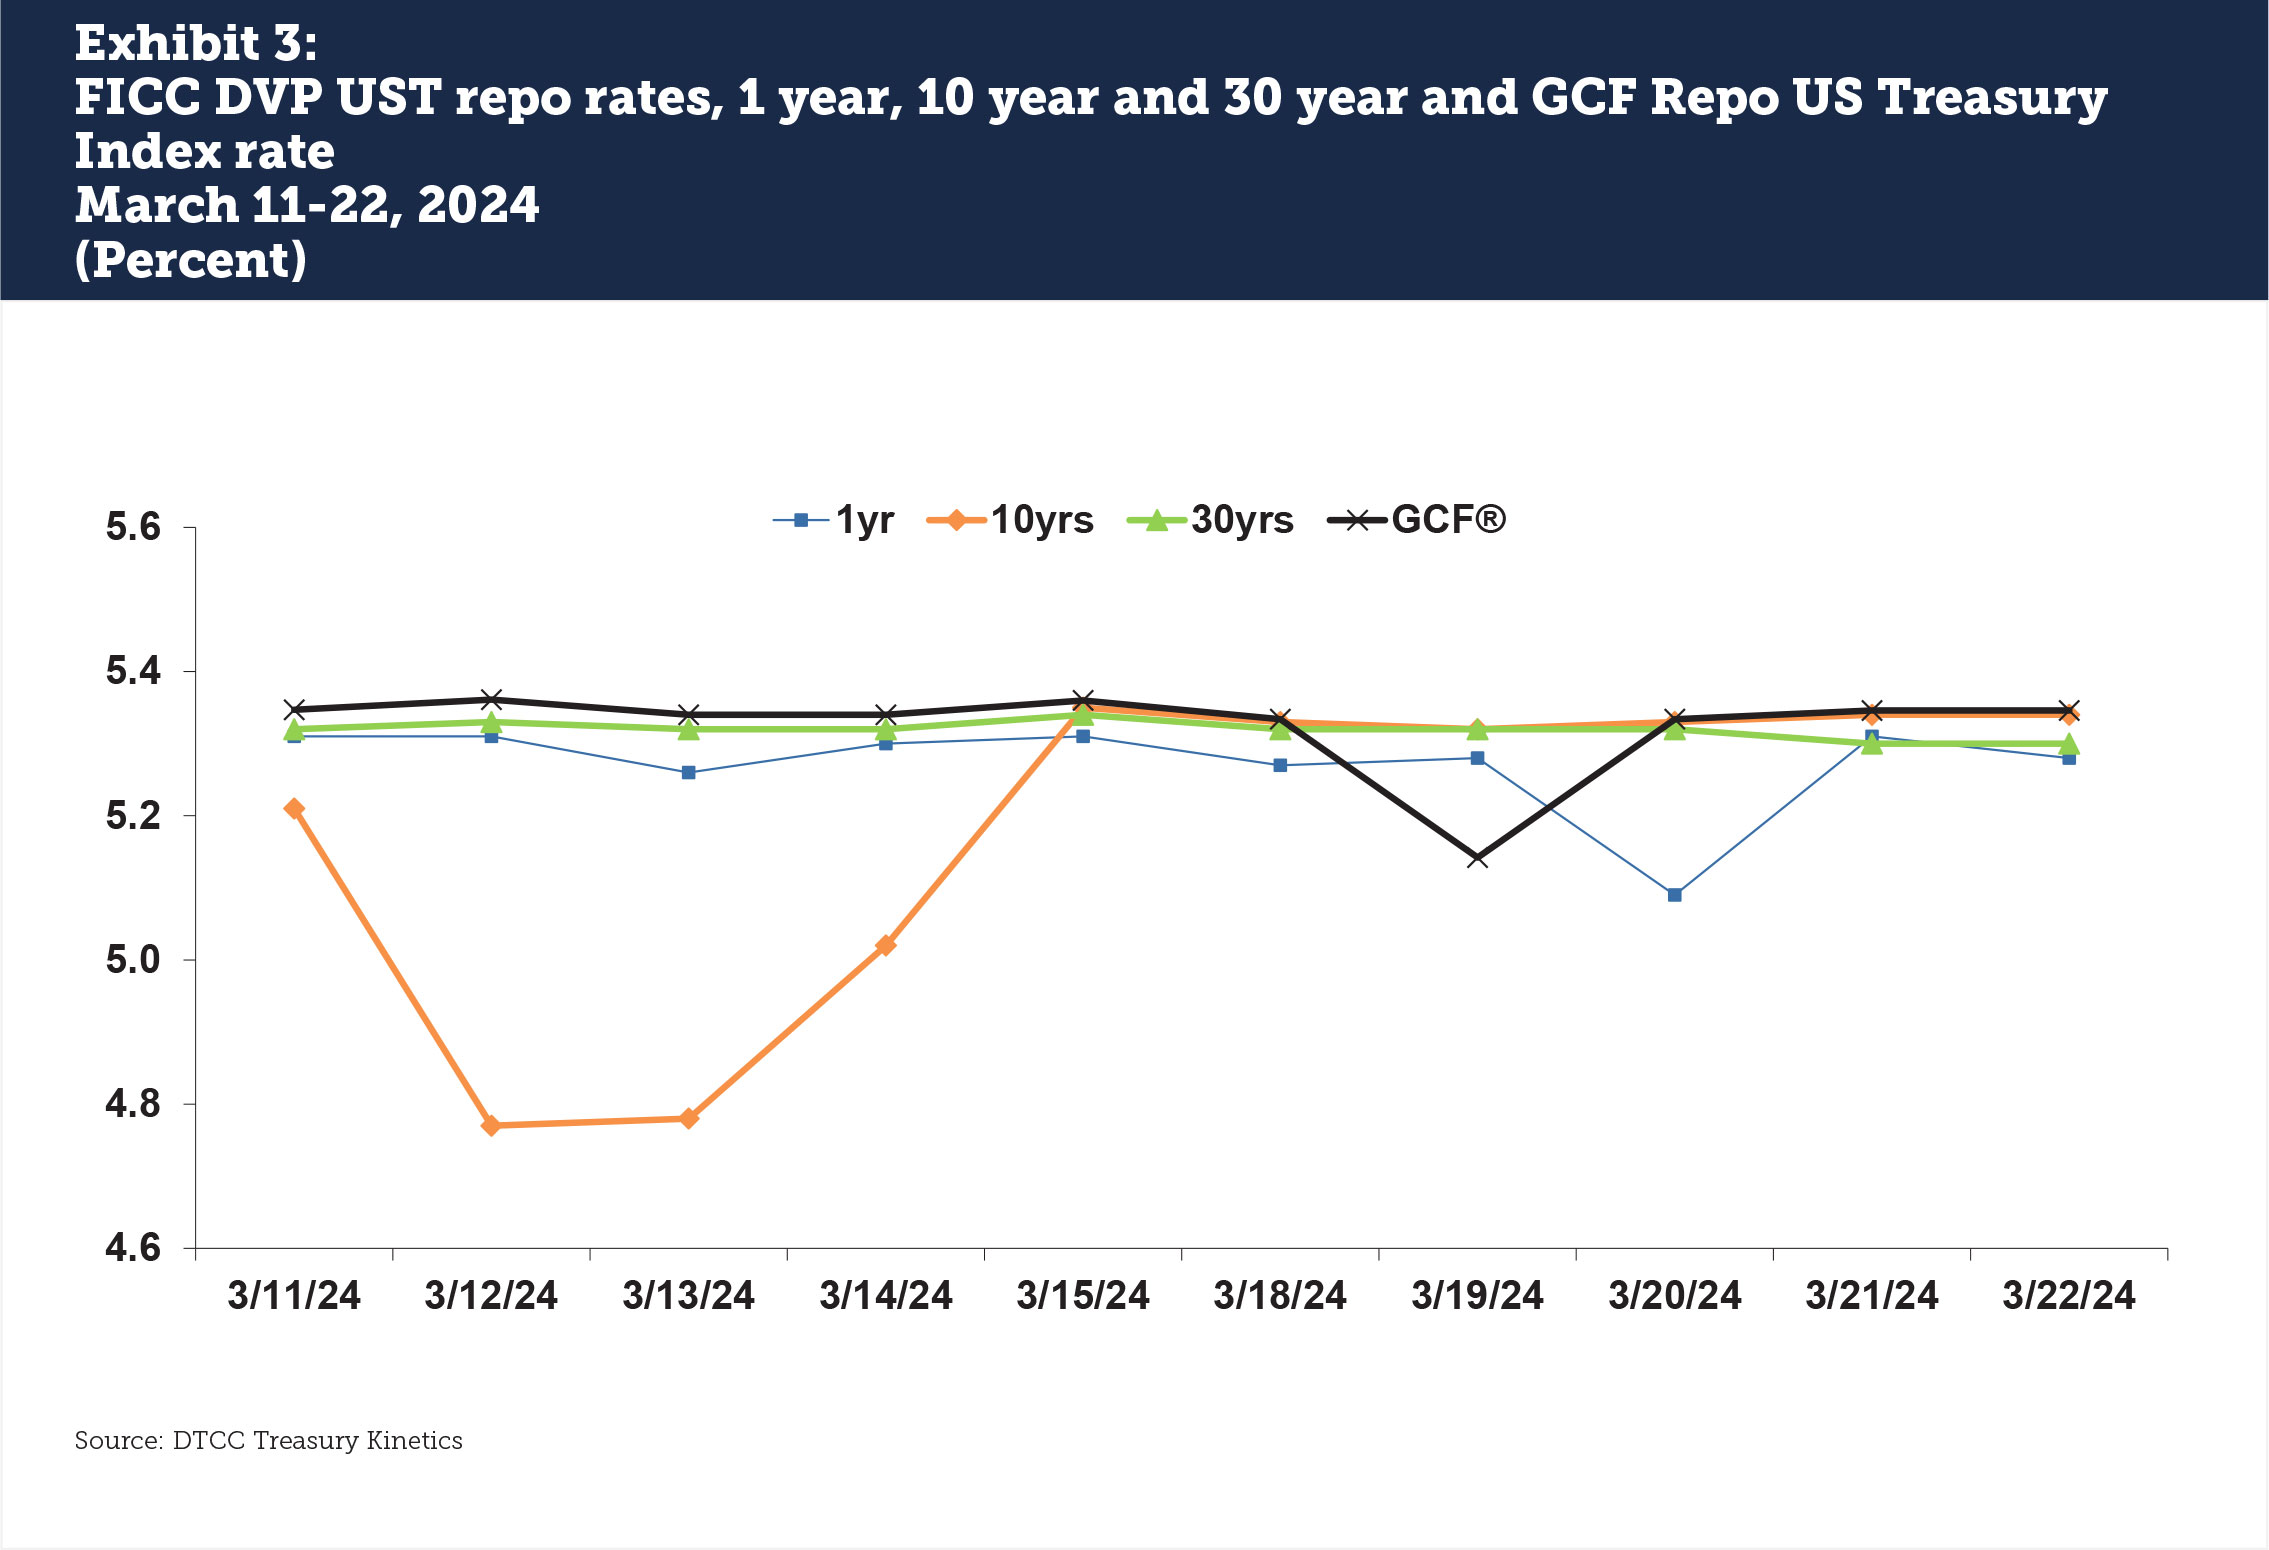
In practice, 2024’s tax payments reduced US money fund holdings by only $61 billion, or 1% of total assets, but this was enough to keep UST repo rates elevated through the week. The one year FICC DVP rate was 5.31% on Friday, March 15, then fell to 5.27% by Monday (see Exhibit 3). The 10 year started off special then rose by 57 bps from Wednesday March 13 to tax day. The 30 year saw the greatest stability, with rates rising just 2 bps on March 15 then declining the next trading day. The DTCC GCF Repo Index rate also rose only 2 bps on March 15.
The unexpected drop in rates that occurred on March 19 was unrelated to tax season. As Reuters reported, “Behind the drop was a large, single trade late in the day involving a big player, according to three market sources and a review of publicly available transaction data. The trade was in the mid-$20 billion range at a 5% rate and happened sometime after 1 pm, according to two of the sources.” This was a one-off unusual situation.
If 1% = 4 bps, does 20% = 80 bps?
An observed 1% drop in US money market fund assets, long-expected on tax day as investors paid the IRS, was correlated with a rise of 2-4 basis points in DTCC GCF Repo Index rate, the 1 year and the 30 year. Trading trends in the 10 year started out special then returned to General Collateral by March 15. Leaving the 10 year special aside, if a 1% drop in cash from money funds resulted in 2-4 basis points of increase in General Collateral, would a 20% drop mean 40-80 basis points in higher repo costs?
The easy answer to this is probably no: for the over 50 institutions with access to the Standing Repo Facility (SRF), a Fed ceiling on rates of 5.5%, compared to a DTCC GCF Repo Index rate of 5.34%, leaves only 16 bps of room before dealers taking in cash becomes financially unattractive. Firms that are not participants to the SRF however have a different set of options, and may pay the SRF rate plus a spread on top that could be 5-20 basis points higher. Thanks to the SRF, a return to the high volatility month of September 2019 is unlikely.
On the client side, as repo rates rise due to cash withdrawals, low-spread basis trades that rely on stable day-to-day repo financing costs for the long leg of US Treasury purchases may find their bets no longer attractive. A reduction in basis trades would reduce repo demand, which in turn will reduce rates: this should return the market to equilibrium. However, depending on the amount of reduction, this could also result in US Treasury volatility that could influence an entirely different set of actors to participate in long and short UST investing.
The example of tax season shows how the money market fund Wall of Cash could be a significant actor in repo and US Treasury market rate volatility. As interest rates fall and equity markets become more attractive, repo dealers should remain attentive to how the speed of investor withdrawals may reach their business sooner rather than later.
This article was commissioned by DTCC Data Services. However, the opinions expressed herein are solely those of Finadium and the article’s author. DTCC does not endorse these opinions and they do not necessarily represent the opinion of DTCC or any of its affiliates.