


Finadium News & Opinion has created a round-up of monthly, quarterly and half-year statistics releases from across repo, securities lending, collateral, cross-product and other securities finance-related markets published throughout August, providing a broad overview of backwards-looking market dynamics. In this round-up, we feature figures from BrokerTec, Clearstream, CLS, DataLend, DTCC, EquiLend, ETFGI, Eurex Repo, Hazeltree, ICI, LCH RepoClear, MTS Repo, OCC, OFR, S&P Global Market Intelligence, S3 Partners, SWIFT, Tradeweb, and WFE.
Repo results
Eurex Repo showed both year-over-year (y-o-y) and month-on-month (m-o-m) increases across the board. The repo market saw an 18% increase in average daily volume to €209.9 billion ($232.9bn) y-o-y, also up from June’s €164.9 billion. The overall daily repo volume went up by 12% in July compared to July 2023 at €374.2 billion, also up from the previous month’s €321.6 billion. GC Pooling volumes grew by 6% to €164.3 billion y-o-y, compared to €156.7 billion m-o-m.
| Repo: Average daily term adjusted volume on Eurex Repo | July 2024 | July 2023 | Change |
| GC Pooling (billion €) | 164.3 | 155.2 | +6% |
| Repo Market (billion €) | 209.9 | 178.4 | +18% |
| Total (billion €) | 374.2 | 333.7 | +12% |
Source: Eurex Repo
“Eurex Repo enjoyed a busy month in July with plenty of term activity as clients digested the latest ECB Governing Council decisions and comments. They also started looking ahead to the policy decisions and liquidity conditions expected in the year’s second half,” wrote Frank Gast, managing director and member of the Management Board at Eurex Repo, in a market briefing.
The month-on-month rise in term-adjusted volume of 16% was mainly driven by a 26% rise in Special Repo. The period from January to June 2024 showed continued growth of about 8% compared to the same period in 2023, with the GC Pooling market growing by 15% while Repo volumes edged upwards by around 2%.
Year-on-year, the average outstanding volume across all market segments decreased by 8%. This was primarily driven by the repo Market, which fell by around 9%. For the first seven months of this year, the average outstanding volume across all markets increased by 6.4% compared to the same period last year. This increase was driven by much higher outstanding volumes in GC Pooling (+24%).
For spreads and collateral, July saw continued stability in short-term rates within the EUR GC Pooling Market. The average spread between the ECB and EXT ECB baskets remained within one basis point.
“At month end, we saw a temporary dip in Overnight term in both the ECB and EXT ECB baskets to a low point of 3.65%, which was slightly below ESTR and produced a spread to the trading days on either side of around 6bp. By comparison, the end of June saw only a drop of 3bp,” wrote Gast.
Eurex Term Repo trading activity in the standard terms ranging from one week to twelve months in EUR GC Pooling remained animated. Longer terms in nine and twelve months were particularly busy as longer-term ESTR rates began to fall. In the ECB basket, it was notable that the average repo rate of the 12-month term declined by around 22bp over the course of July.
“In the Repo Market segment we saw continued animation in Euro government bond executions, particularly out to two and three-month terms,” Gast wrote.
The GC Pooling Green Bonds basket continued its upward trajectory in terms of trade volumes and number of participants in the market, setting a new traded volume record slightly above €10 billion for the month. The cleared volume has increased to €36 billion since its launch on 29 April, indicating a growing interest and demand for green bond investments within the market. Repo rates in the basket continued to average around 2bp below the ECB GC Pooling basket in Overnight and one-week terms.
DTCC announced its Fixed Income Clearing Corporation’s (FICC’s) Government Securities Division (GSD) processed $8.8 trillion in daily activity on July 31. The increase represents a jump of over 30% year-over-year.
This significant and continued growth can be attributed to rising volumes and activity in the US Treasury market as well as the continued expansion of FICC’s Sponsored Service, which saw a new peak volume of $1.4 trillion on August 15, growth of 78% year-over-year, including FICC’s Sponsored GC Service, which by itself has seen growth of 94% year-over-year. There are now over 2,400 sponsored members across 50 approved jurisdictions participating in FICC clearing.
Laura Klimpel, managing director and head of DTCC’s Fixed Income and Financing Solutions, said in a statement: “Our new milestones in daily activity demonstrate FICC’s robust ability to support rising volumes and volatility and a smooth implementation of the SEC’s expanded US Treasury Clearing rules.”
FICC’s Sponsored Service generated an aggregate average of approximately $500 billion daily in balance sheet savings across the industry in July 2024, peaking on July 31 at approximately $616 billion of aggregate balance sheet savings across the industry.
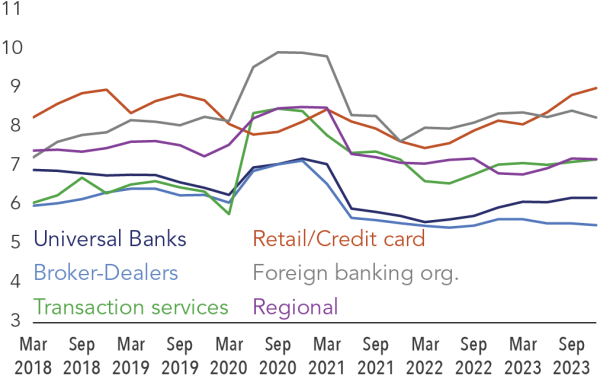
The US Office of Financial Research (OFR) reported that supplementary leverage ratios (SLRs) for most bank groups rose year-over-year in 2023 due primarily to higher Tier 1 Capital levels offset by balance sheet growth and more repo exposure. Broker-dealers saw a decrease in SLRs due to increased derivatives and repo exposures. SLRs for US operations of foreign banks (FBOs) were slightly lower because of growth in Tier 1 Capital levels that was offset by a general reduction in on- and off-balance sheet assets. Over time, SLRs for each group have remained in a narrow range.
Graph: Supplementary Leverage Ratio for Banks (%):
In Tradeweb’s money markets segment, repo A-D-V was up 25.3% y-o-y to $621.8 billion, also up from June’s $599.2 billion. Increased client activity on Tradeweb’s electronic repo trading platform drove record global repo activity. The combination of quantitative tightening, increased collateral supply, and current rates market activity shifted more assets from the Federal Reserve’s reverse repo facility to money markets. Retail money markets activity was strong as markets priced in less aggressive Fed rate cuts.
LCH RepoClear reported July nominal volumes at €4.97 trillion at its UK-based clearing service (LTD), up from June’s €4.13 trillion trillion. At the Paris-based CCP (SA), nominal volumes were at €22.53 trillion, up from the previous month’s €21.36 trillion. Year-to-date, total notional volumes are at €179.42 trillion, which breaks down to €27.66 trillion at LCH RepoClear LTD and €151.76 trillion for LCH RepoClear SA.
Euronext reported that July repo ADV was down 6% m-o-m at €168.4 billion, but up y-o-y from €159.1 billion.
|
Jul-24 | Jun-24 | Change % MOM |
Jul-23 | |
| ADV MTS repo | 168,429 | 178,550 | -6% | 159,121 | |
| Term-adjusted ADV MTS Repo | 494,576 | 474,271 | 4% | 423,456 |
CME Group reported that BrokerTec US repo average daily notional value (ADNV) increased 8% to $291 billion, down from June’s $304.4 billion. EU repo was at $297.4 billion, down 9% y-o-y, also down from the previous month’s $307.8 billion.
| Average daily notional volume (single-sided billions) | ||||||
| July 2024` | Jul-23 | Change | ||||
| US Repos | 291.4 | 270.3 | 8% | |||
| EU Repos (EUR) | 297.4 | 326.7 | -9% | |||
Source: CME Group
Securities lending stats
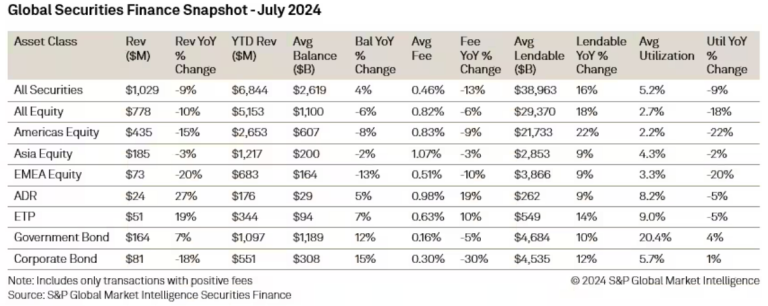
S&P Global’s securities finance snapshot showed monthly revenues decline by 9% y-o-y to $1.029 billion, but were up from June’s $962 million. Average fees across all securities declined 13% y-o-y to 46bps with the largest declines seen across corporate bonds (-30%). EMEA equities continued to struggle as average y-o-y fees fell by 20%. As asset valuations continued to grow during the month, lendable increased by 16% y-o-y pushing utilization lower by 9% y-o-y.
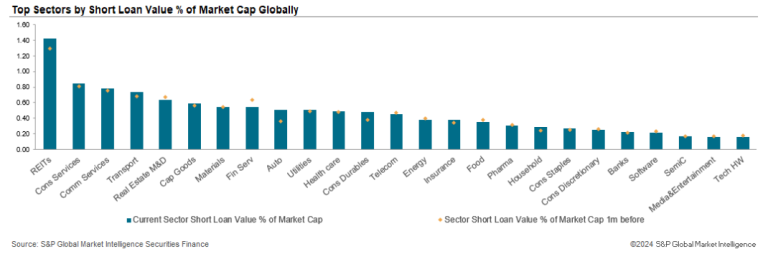
S&P Global’s long/short report ranks top shorts by their percentage of shares outstanding on loan. Over July, short interest increased across global equities. In the fixed income markets, government bond utilization decreased by 13bps m-o-m and increased by 19bps m-o-m across corporate bonds (value of implied short positions vs value of institutional longs).
The most shorted sectors per region were: global equities – REITs; US equities – REITs; APAC equities – Materials; European equities – Real Estate Management and Development.
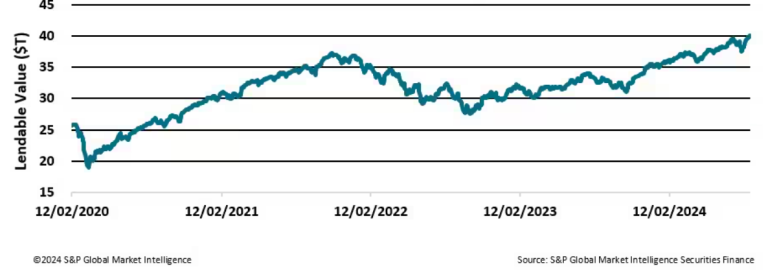
In addition, S&P Global reported that a combination of growth in asset valuations, new inventory from an expanding range of client types and a raft of innovation have propelled lendable inventories past the $40 trillion mark for the first time, reaching $40.13 trillion on August 27th, 2024.
At the Options Clearing Corporation (OCC), securities lending average daily loan value for July was $167.6 billion, up 23% y-o-y, also up from June’s $163.7 billion. Total transactions were up 30.9% at 248k, also up from the previous month’s 215k.
| July 2024 Avg. Daily Loan Value | July 2023 Avg. Daily Loan Value | % Change | July 2024 Total Transactions | July 2023 Total Transactions | % Change | |
| Market Loan + Hedge Total | 167,611,265,360 | 136,247,037,293 | 23.0% | 247,572 | 189,181 | 30.87% |
Source: OCC
EquiLend reported that July started and ended “with a flourish”, according to Mike Norwood, head of Trading Solutions. The NGT platform saw 2,825,390 trades agreed, versus $2.7 trillion. This figure represents +12% over June 2024 and +20% from July 2023 as both equities and fixed income saw increased demand at +13% and +38%, respectively.
Following a new all-time daily high total trade count of 157,562 set on July 1 and resulting from index reconstitution activity, the remainder of the month saw relatively stable trading activity. Equity markets were flat until the last few days of the month as recessionary fears on the back of US economic data started to impact market sentiment, resulting in a sudden sell-off.
DataLend reported that securities lending revenue was down 11% y-o-y at $843 million in July, but up from June’s $790 million. Global broker-to-broker activity, where broker-dealers lend and borrow securities from each other, totaled an additional $219 million in revenue in July, down 7% y-o-y.
- Amid a continued bull market, US equity lending revenue remained the most significant laggard, falling 20% y-o-y. Decreased fees were the driver, with the average cost to borrow for US stocks declining 21% from July 2023. However, with fees bouncing in July, US equities showed positive momentum with a 22% revenue increase month-over-month.
- In the global equity lending market, Taiwanese securities continued to generate strong returns with revenue increasing 59% year-over-year. Loan balances for Taiwan equities climbed a sharp 43% while fees also increase 11% compared to 2023.
- In fixed income, global lending revenue for corporate bonds continued to cool, falling 23% year-on-year. The dip was driven by investment-grade issuances, where a 28% drop in fees led to a 21% decline in revenue.
- Global sovereign debt revenue improved 8% year-on-year as balances climbed 15%. US Treasury lending accounted for the bulk of the improvement, with revenue rising 14%.
The top five earning securities in July were Sirius XM Holdings Inc. (SIRI US), Lucid Group Inc. (LCID US), Beyond Meat Inc. (BYND US), ImmunityBio Inc. (IBRX US) and NuScale Power Co. (SMR US). The five securities in total generated $87 million in revenue for the month.
Hazeltree’s Shortside Crowdedness Report listed the top 10 shorted securities in the Americas, EMEA, and APAC regions in the large-, mid-, and small-cap ranges.
In the Americas large-cap category, Super Micro Computer topped the list as the most crowded security and also had the highest institutional supply utilization (22.85%).
In the EMEA large-cap category, luxury goods conglomerate LVMH continued to dominate as the most crowded security, maintaining this position since the beginning of the year. H&M Hennes Mauritz AB had the highest institutional supply utilization (56.15%).
In the APAC large-cap category, Toyota continued its hold as the most crowded security, a position held since February, and Nippon Steel Corp had the highest institutional supply utilization (34.14%)..
S3 Partners‘ director Matthew Unterman published a recap of July Short Interest (SI) Movers (no link available), representing the top 10 largest increases and decreases in terms of SI Shares and SI % Float for US-listed single name equities (ex ADRs & ETFs) for the month of July. Both the S&P500 and Russell3000 Indices ended the month up by +0.86% and +1.62%, respectively.
Largest increase in SI shares: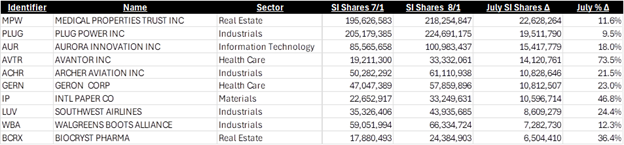
Largest decrease in SI shares: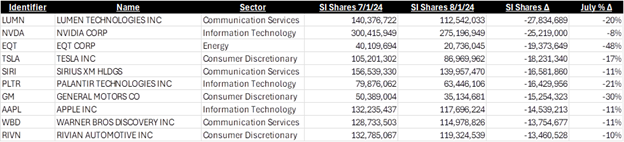
Largest increase in SI % float: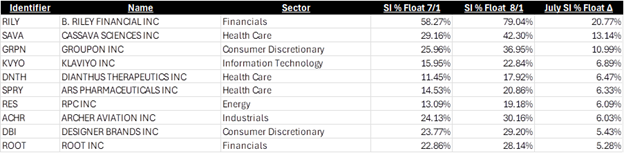
Largest decrease in SI % float: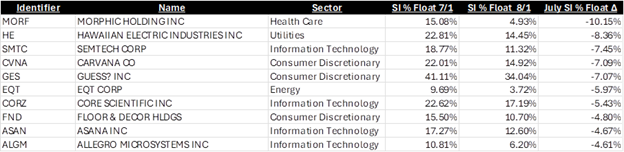
Source: S3 Partners
Cross-product count
At Clearstream, global securities financing outstanding volumes in June were at €707.6 billion, up 3% y-o-y and down from June’s €715.3 billion. YTD, volumes outstanding were up 16% y-o-y to €715.82 billion.
| Global Securities Financing – volume outstanding (€ billion) | |||||
| 24-Jul | 23-Jul | Change | YTD 2024 | YTD 2023 | Change |
| 707.6 | 688.35 | 3% | 715.82 | 615.83 | 16% |
Source: Clearstream
FX figures
In July 2024, CLS reported average daily traded volumes of $2.15 trillion, an increase of 8.2% compared to July 2023, and slightly down from June’s $2.26 trillion. Over the same period, FX forward volumes decreased by 14.1%, while FX swap volumes and FX spot volumes were up by 14% and 2.7%, respectively.
SWIFT reported that in July, the RMB retained the fourth most active currency for global payments by value, with a share of 4.74%, slightly up from June’s 4.6%. Overall, RMB payments value increased by 13.37% compared to June 2024, whilst in general all payments currencies increased by 10.29%. In terms of international payments excluding payments within the Eurozone, the RMB ranked 5th with a share of 3.32% in July2024.
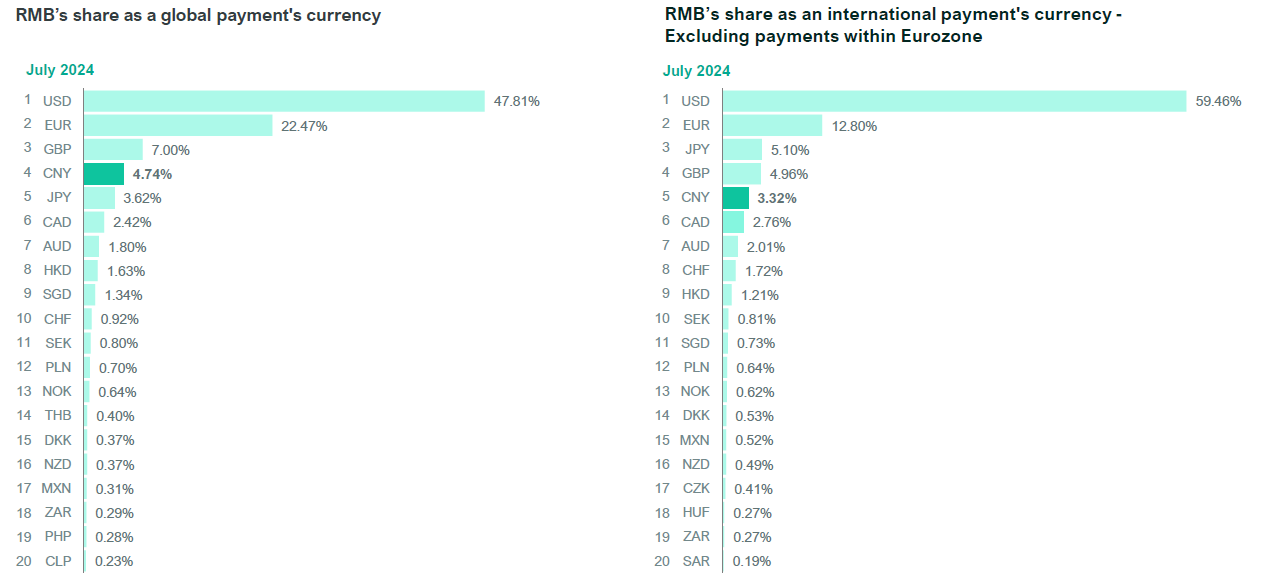
Source: SWIFT
Capital markets
ETFGI reported that assets invested in the global ETFs industry reached a new record high of $13.61 trillion at the end of July, beating June’s record of $13.14 trillion. July saw ETFs gathering $216.64 billion in net inflows and bringing year-to-date net inflows to $947.00 billion, which is the highest on record and marking the 62nd month of consecutive net inflows.
“The S&P 500 index increased by 1.22% in July and is up 16.70% YTD in 2024. The developed markets excluding the US index increased by 3.37% in July and is up 8.12% YTD in 2024. Ireland (up 6.48%) and Belgium (up 6.42%) saw the largest decreases amongst the developed markets in July. The Emerging markets index increased by 0.57% during July and is up 8.70% YTD in 2024.Greece (up 6.93%) and United Arab Emirates (up 6.18%) saw the largest increases amongst emerging markets in July”, said to Deborah Fuhr, managing partner, founder, and owner of ETFGI, in a statement.
The Investment Company Institute (ICI) reported that total money market fund assets increased by $21.05 billion to $6.26 trillion for the week ended Wednesday, August 28. Among taxable money market funds, government funds increased by $21.14 billion and prime funds increased by $535 million. Tax-exempt money market funds decreased by $618 million.
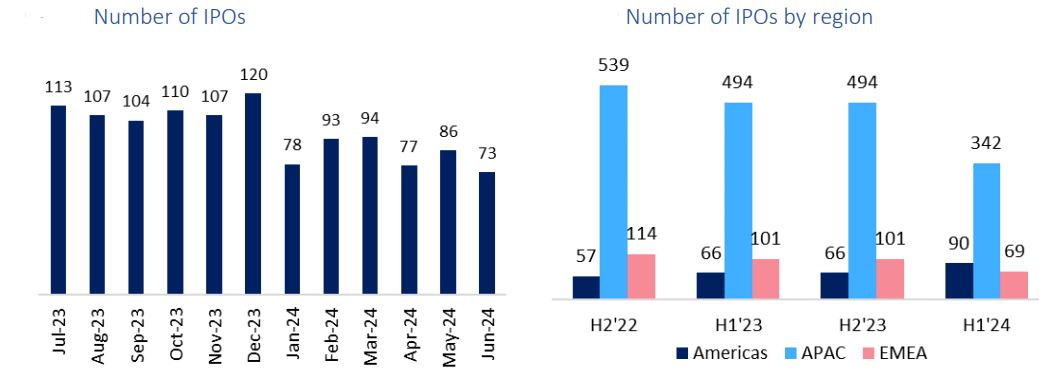
World Federation of Exchanges (WFE) data show that trading value and volumes surged in the first half of 2024: trading value increased 11.7%, and volumes rose 9.6%. Markets were highly liquid globally despite the backdrop of economic and geopolitical uncertainties.
In the six months to July 2024, global equity market capitalization was up 5%, driven largely by the Americas, whilst the rapid growth in the APAC region reported at the end of 2023 slowed. EMEA’s market capitalization was flat.
Compared to the previous half, IPOs fell 24.2%. The number of IPOs in the Americas rose by 36.4%, whilst both APAC and EMEA registered decreases, down -30.8% and -31.7% respectively. The number of listed companies is down marginally by 0.3% globally, though the number of listings in the Americas fell less than the same period the prior year. The EMEA region saw the sharpest decrease in number of listings, and APAC listings grew by 0.48%.
The capital raised through IPOs saw a 10% decline compared to H2 2023 and a 17% decline with respect to H1 2023, a result driven by the APAC region, which in H1 2024 recorded its minimum level in the last five years, while the Americas and EMEA regions experienced significant increases (97.1% and 121.4% respectively, compared to H2 2023; and 89.2% and 86% respectively, compared with H1 2023). Despite the decline, global markets hosted seven unicorns in the first half of this year.
***Because firms report a wide variety of activities and products, the results are not a straight-up comparison, rather the intent is to provide a snapshot of shifting market dynamics across industry players both broad and granular as well as a review of the state-of-play before the next set of results stream.
[/emember_protected]