

Researchers from Stanford University, the Federal Reserve Bank of New York, and Princeton University investigate the dynamics of liquidity in the US Treasury market. In particular, they focus on the relationship between yield volatility and Treasury market illiquidity and highlight how limited dealer intermediation capacity worsens market illiquidity beyond yield volatility, but only at high levels of dealer balance sheet utilization, as in March 2020.
The status of US Treasury securities as the world’s premier safe haven rests in part on the depth and liquidity of the market in which they are traded. The results shed new light on the dependence of market liquidity on asset volatility and dealer intermediation capacity, and adds focus to ongoing policy efforts to improve the resilience of the US Treasury market, an anchor of global capital markets.
This study combines highly relevant data on dealer-level balance sheet positions and comprehensive transaction-level Treasury security trades, among other data sets, to show that there is a significant loss in US Treasury market functionality when intensive use of dealer balance sheets is needed to intermediate bond markets, as in March 2020.
While yield volatility explains most of the variation in Treasury market liquidity over time, when dealer balance sheet utilization reaches sufficiently high levels, liquidity is much worse than predicted by yield volatility alone. This is consistent with the existence of occasionally binding constraints on the intermediation capacity of bond markets.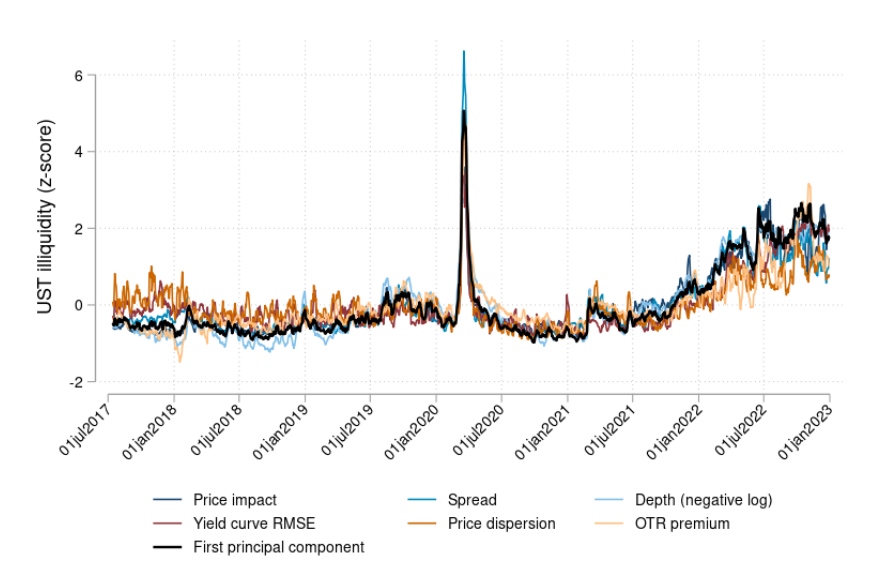
Note: US Treasury market illiquidity measures. Average z-scores across the 2-, 5-, and 10-year maturity sectors of price impact, bid-ask spread, and depth from the interdealer market and on-the-run premium, price dispersion, and yield curve root-mean-squared-error (RMSE) from the dealer-to-customer market. The first principal component of the 18 z-scores is plotted in bold. All variables are shown, for clarity, in the form of five-day moving averages. The sample period is July 10, 2017 to December 31, 2022 excluding holidays and early closes (T=1,336 trading days). Source: Bank for International SettlementsRead the full report