

The growth of the global ETF market has left investors and intermediaries with a need for information on flows and interconnectivity between products, especially when ETF inflows and outflows can impact underlying equity prices or even other asset classes. Access to ETF data on securities lending, creation and redemption and composition can help inform both long and short trading strategies for success.
Participants in the ETF market have become a diverse audience. Long/short investors are increasingly using these products to capture exposure without the work of purchasing the underlying securities. Systematic quantitative traders are earning basis points in arbitrage that may be due to mismatches between the ETF price and its components, financing rates between options and equity markets, or prices between listed exchanges. And Delta One desks are trading ETFs and synthetic baskets that mirror the underlyings but may adjust holdings based on financing and liquidity costs.
These traders are impacted by ETF activity, especially when passive strategies drive purchases of single name equities to ensure that the creation of ETFs remains in line with market demand. No matter the reason, accessing data on ETFs has become a visible opportunity to a broad cross-section of investor types.
The creation of flow signals is an important component of market data, especially given the massive amount of data now available to market participants. Capturing the right signals can provide early indications of market movements, especially for a growing segment like ETFs.
At the same time, assessing data on the composition of ETFs can also show how both the ETF and its underlyings can respond to market pressures. These range from the macro, like interest rate changes, to sector or name-specific trends in technology or corporate actions. Matt Chessum, Director in Securities Finance at S&P Global Market intelligence, says that “keeping sight of how big moves affect asset prices and impact trading strategies across asset classes, geographies and sectors can help investors enhance performance and manage risk.”
While ETF securities lending data is commonly used to identify arbitrage opportunities between the ETF and its underlying, S&P Global Market intelligence is seeing expanded interest in the long-only community for the same or aggregated data to track trends across asset classes. The adoption of ETF flow and composition data by non-leveraged portfolio managers creates a competitive advantage when looking to understand how ETF changes will impact a broad portfolio.
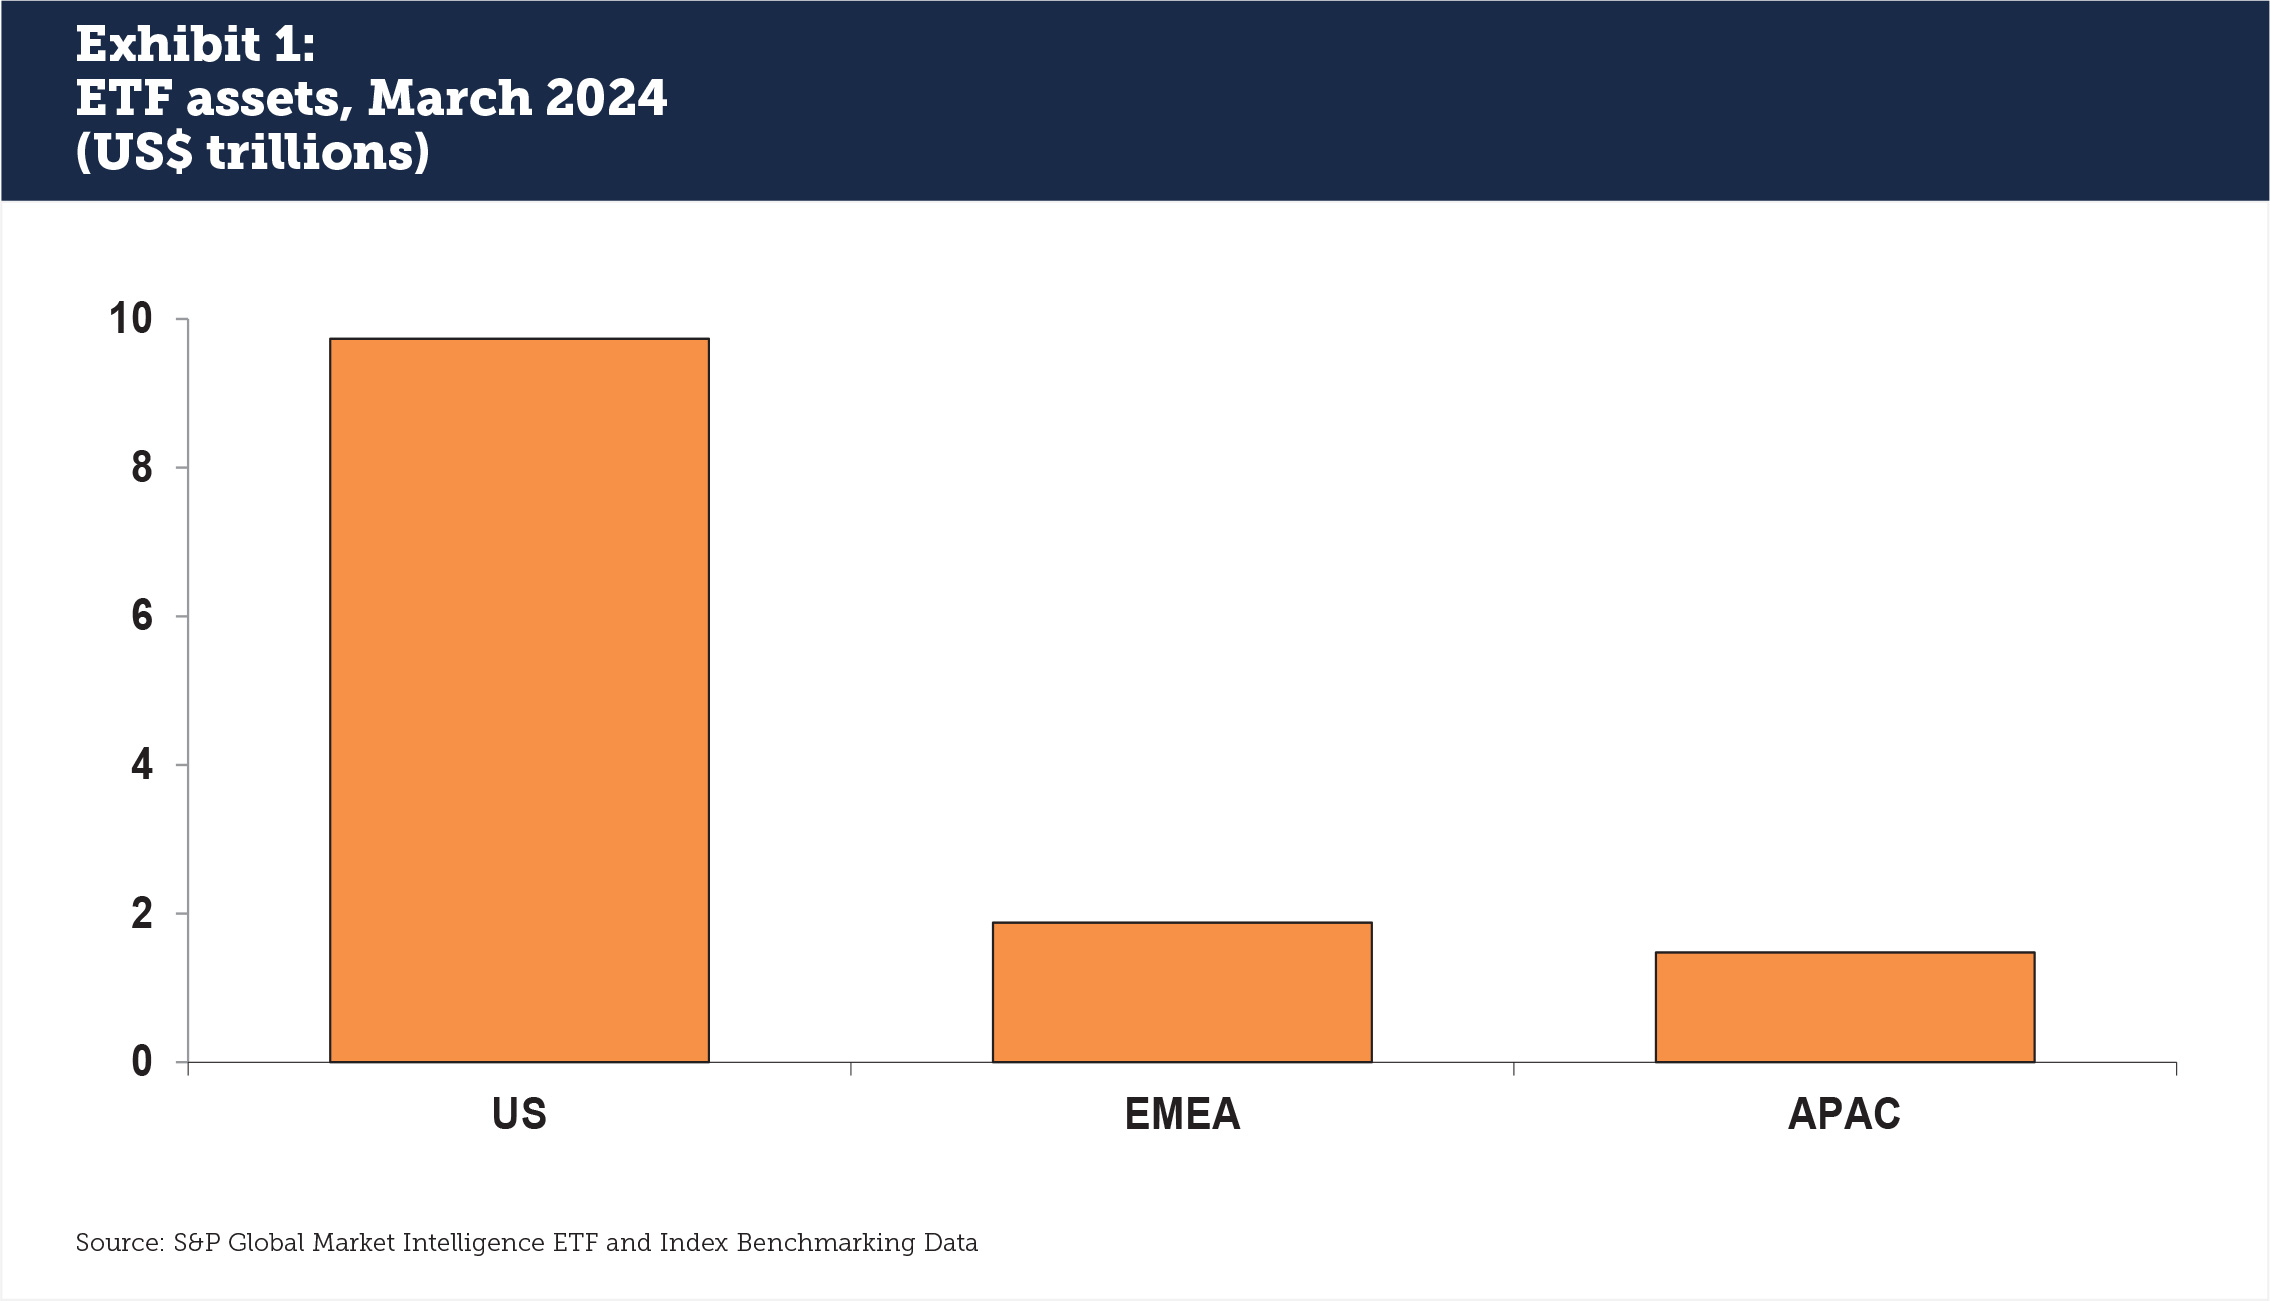
ETFs hit $13 trillion AUM
The ETF market shows signs of continued growth. According to S&P Global Market Intelligence, while ETFs remain a small fraction of global market assets, they now account for over $13 trillion of investor holdings across North America, EMEA and APAC (see Exhibit 1). ETFs represent a more substantial segment of trading activity: BlackRock estimates that ETFs accounted for 31% of all US equity volume in Q4 2023. Investor interest in ETFs is driven by multiple well-documented factors including liquidity, ease of access and increasing customization.
Since 2021, large and small asset managers have been converting some of their active funds into an ETF format, thanks to a 2019 US Securities and Exchange Commission rule that allowed the practice. Morningstar reports around 60 funds that expected to take this step between 2021-2023. Tax efficiency is a major reason for the change as ETFs do not distribute capital gains; rather, investors can sell the ETF at a time of their choosing with a taxable impact. A conversion does not inherently mean attracting greater assets however; much of the attractiveness is still determined by the same criteria as the old mutual fund including brand reputation and track record of the fund.
Projecting market change
A case study of the First Trust NASDAQ Artificial Intelligence and Robotics ETF (ROBT), with a market capitalization of $557 million, shows insights that can be gained for both long and short traders from signal analysis. A turning point happened mid-March, 2024, when ROBT’s AUM rose and then dropped the next day by $50 million, or 10% of market capitalization (see Exhibit 2). At the same time, the securities borrow fee rose from 70 bps to 94 bps, a 35% increase. The increase in borrow fees suggested a change in market perception towards the sector.
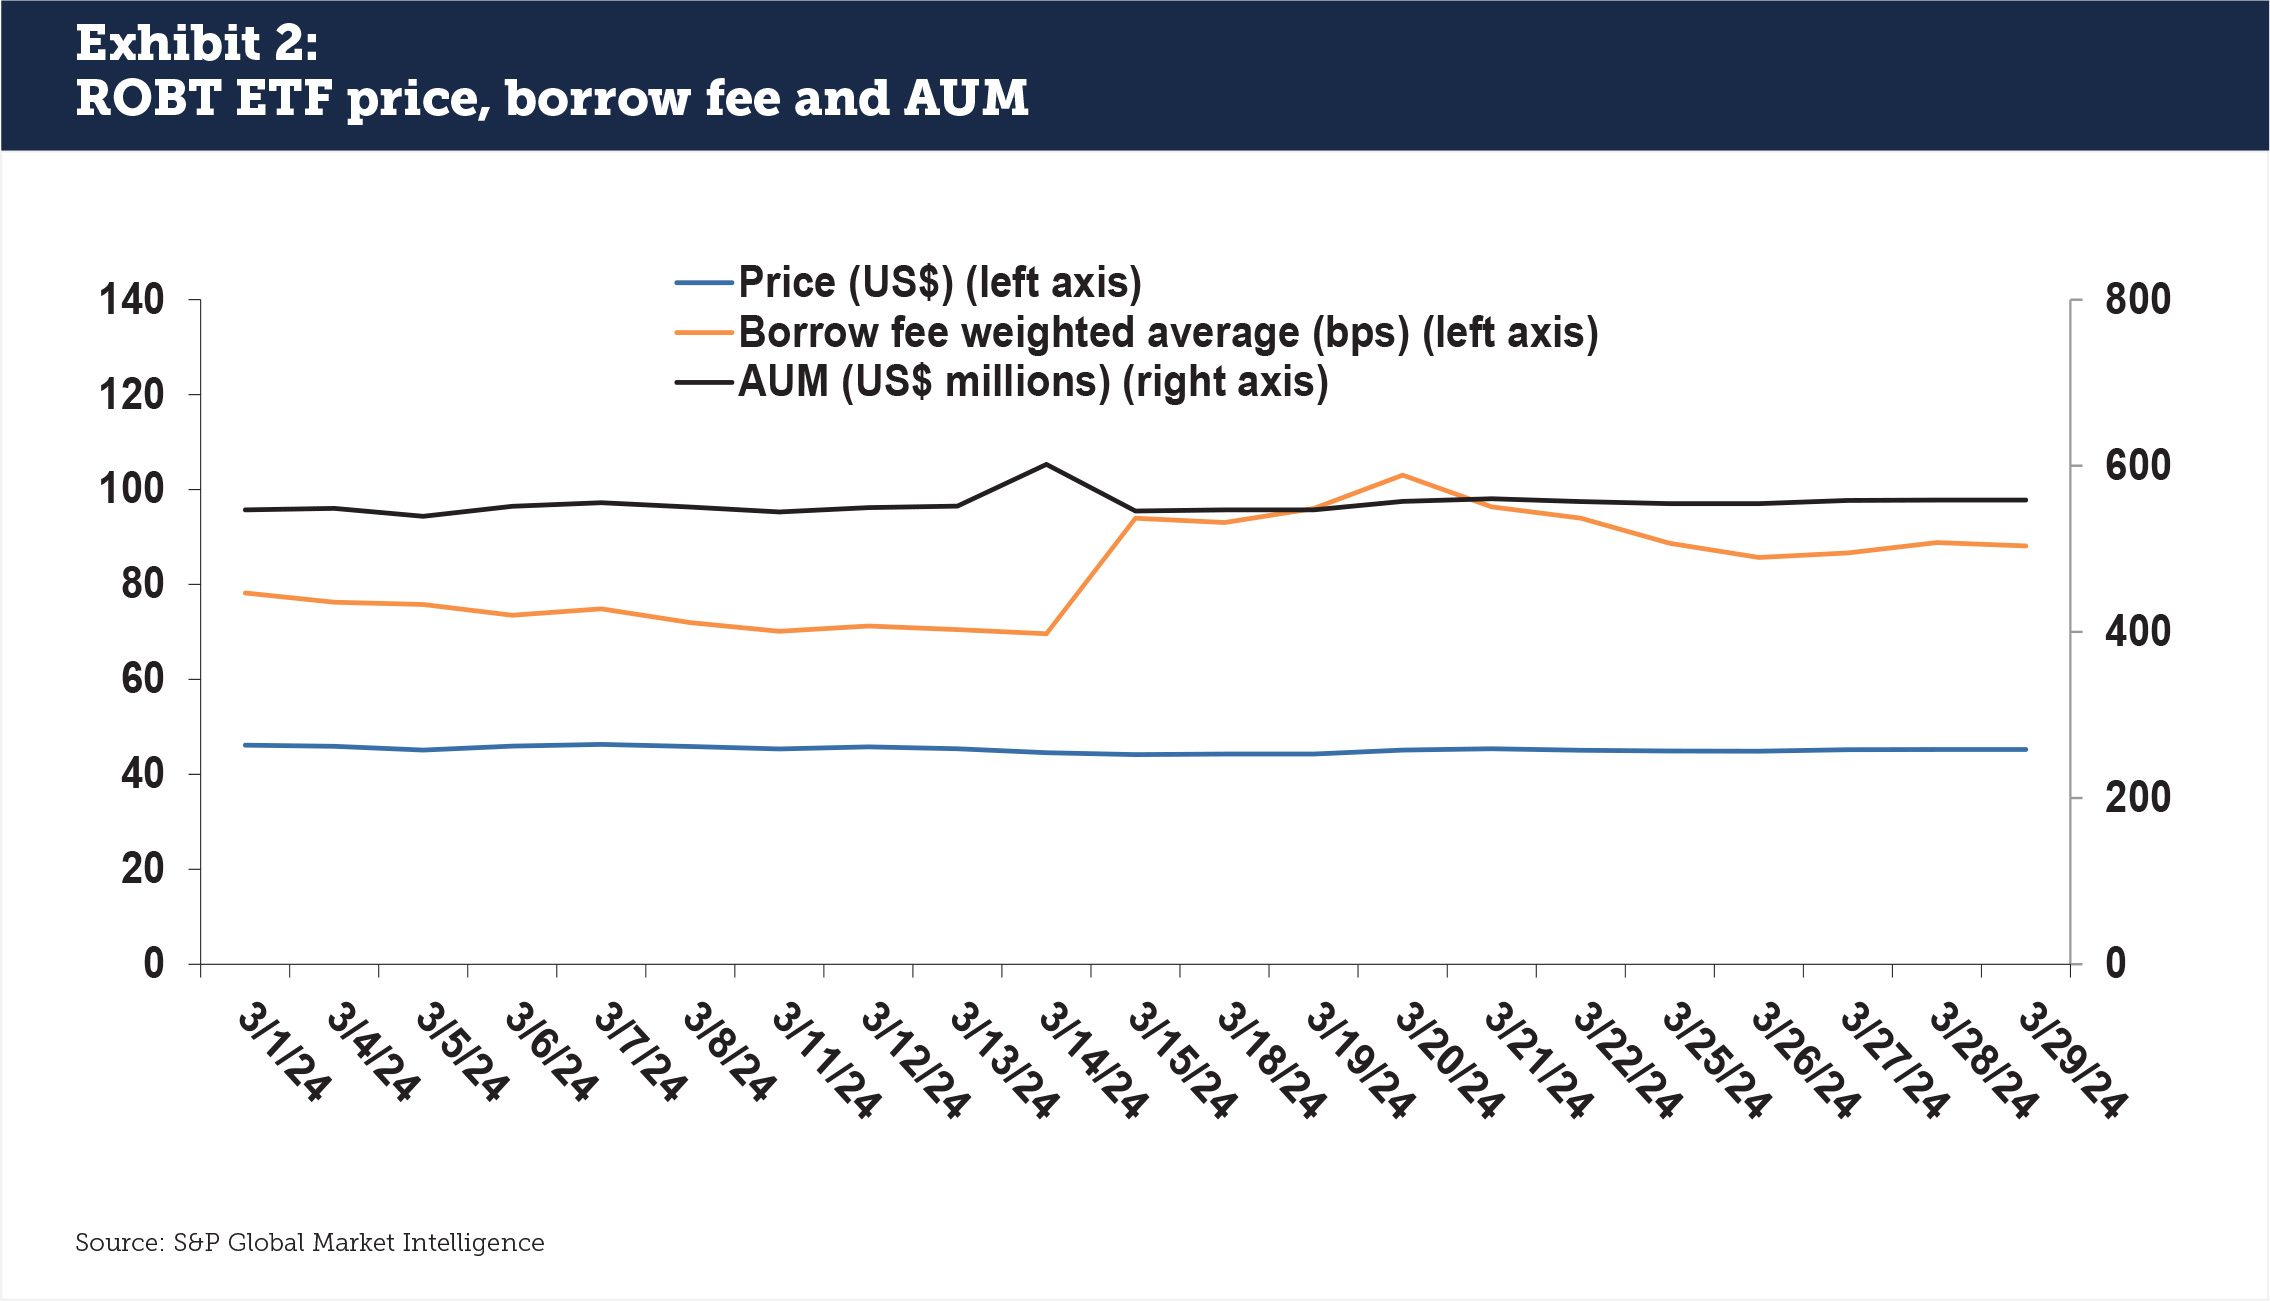
In this case, the borrow fee increase of ROBT was a signal of movement in several top holdings that experienced downward price shifts in the last two weeks of March. These included AeroVironment, down 11%; DarkTrace, down 9%; Mobileye, down 5%; and Cadence Design Systems, down 4%. The ETF price stayed constant due to broad market diversification, but the uptick in the borrow rate was indicative of change in the underlying securities. The signal for both long and short investors showed a need to evaluate the ETF’s composition more closely.
Looking from the bottom up
Most investors look at ETFs from the top down instead of the bottom up. They are concerned about the securities that the ETF tracks and how that fits into their alpha or beta generation strategy; if an index tracks the S&P 500 then that may be all the investor wants to see when buying or selling. ETFs become much more interesting however when looked at from the bottom up: the way that ETFs are constructed (and deconstructed), how this changes over time and what that means for securities in the ETF can offer investment insights to a wide range of investor types.
ETF data from S&P Global Market Intelligence offers a deep view into the aggregation, normalization, validation and enrichment of ETF data. This can inform an investor that an ETF holding has gone sharply special in the securities lending market, and that a synthetic basket that removes this one security could yield a different financing cost. It can also flag for long-only investors that there could be trouble or opportunity ahead for not just the ETFs holdings but related products in a sector. Index transitions that are known ahead of time may also create a buy or sell opportunity in corporate bonds, convertibles or the listed derivatives market.
Securities lending market professionals are already accustomed to seeing ETFs this way: composition data is frequently used to unlock liquidity or collateral through creations, redemptions and replacements of ETF and synthetic baskets, and for assessing the value of these instruments as collateral. The move to T+1 in North America in May 2024 will increase demand for ETF creation and redemption, as well as synthetics that successfully replicate exposure baskets with reduced costs. S&P Global Market Intelligence’s Chessum notes that “ETF Collateral Lists is a popular tool, extending the number of ETFs acceptable as collateral whilst remaining within eligibility criteria. Monitored daily, this provides huge opportunity to increase business bandwidth without increasing the risk of lower quality collateral. This is yet another great example of the value that accessing ETF composition data can bring to market participants”.
ETF data is now presenting opportunities for both the securities lending market and the broader community of investors. Leveraged, non-leveraged and non-traditional users of ETF data can take advantage of the information flows to create signals for tracking market movements.
This article was committed by S&P Global Market Intelligence.