


Banks have largely absorbed the Leverage Ratio and the Liquidity Coverage Ratio and are taking on the next challenge: maximizing their balance sheet efficiency in a return to profitability. One area getting new attention is margin optimization, where banks, insurance companies, hedge funds and others replicate the margin model that they and their trading partners and CCPs use across product lines.
The end result of this optimization is smarter decision-making about what trades to make based on cost savings in margin utilization. For larger participants in collateralized trading activity, this could translate into tens of millions in annual savings across Initial and Variation Margin.
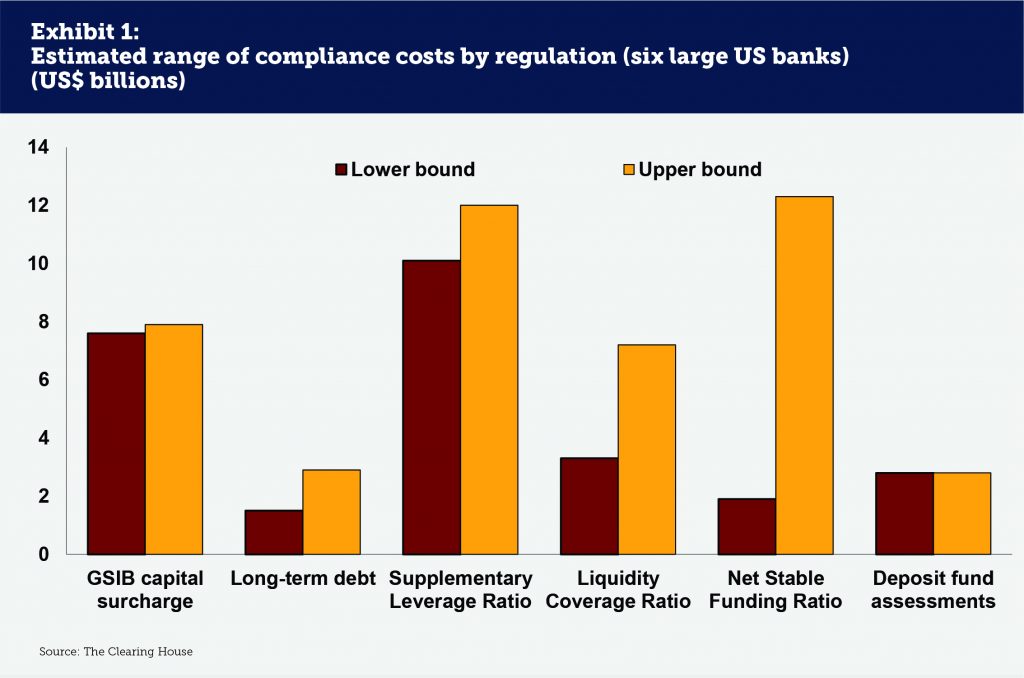
A focus on cost management makes sense given the realities of the regulatory environment. In a 2014 study, The Clearing House looked at the cost of regulatory compliance charges for capital-related rules at six major US banks. The study found that new regulations were set to increase compliance costs by between US$27 to US$45 billion annually (see Exhibit 1). This is an average of US$4.5 to US$7.5 billion per bank, with the Net Stable Funding Ratio (NSFR), the Supplementary Leverage Ratio, the GSIB capital surcharge and the Liquidity Coverage Ratio (LCR) as the four largest items. While there is not much to do about the GSIB surcharge, margin optimization can help control exposures that contribute to the Leverage Ratio, NSFR and LCR.
The Components of Margin Optimization
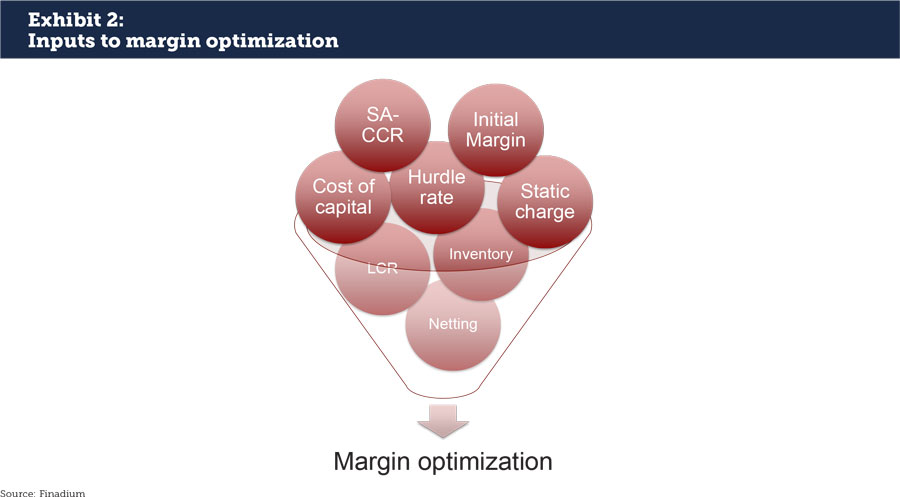
The question that margin optimization seeks to answer is not whether costs can be reduced – in most cases they can – but how banks and investors can best achieve this end result. Currently, margin is either determined on a trade by trade basis or is allocated within a business unit and often after the fact. Margin optimization can move decision-making to pre-trade and help determine if a specific trade is helpful or harmful to margin requirements. Decisions about margin on an institution-wide basis cannot be gathered in the time span of a phone call without technology; performing this analysis in real-time, and capturing diverse data points, such as cost of capital and available inventory, is the fundamental idea behind margin optimization (see Exhibit 2). With technology, however, it becomes possible to calculate the funding impact of margin, also called Margin Valuation Adjustment (MVA).
Incorporating multiple products into one margin optimization calculation is a critical part of the process as well, and one that supersedes traditional siloes in favor of an enterprise-wide view of margin costs. The more business units are incorporated in margin optimization and can be included in a dynamic feedback loop, the more that the entire organization can benefit from the output. It is important also to note that margin optimization is not the same as collateral optimization; margin optimization deals specifically with the requirements of counterparties and netting, whereas collateral optimization takes a bigger view of firm-wide collateralized trading requirements.
Modeling Margin Requirements at Banks and CCPs
Margin rules play an important role in determining how and whether to trade. There are countless examples of margin being the deciding factor on counterparties, for example on September 1, 2016 when some countries adopted non-cleared derivatives margin rules while others did not, which led to a halt in trading as new rules were reviewed. Entire product sets are also winners or losers when it comes to margin, notably cleared futures versus cleared swaps products. Futures exchanges get to set their own margin rules, for example a 1-day time horizon and the use of the SPAN model for Deliverable Swap Futures compared to a 5-day time horizon and a 99% confidence HVaR model (see Exhibit 3). ISDA’s SIMM model uses a Sensitivity Based Approach, a 10-day time horizon and a 99% confidence interval. ISDA’s SIMM Initial Margin is expected to be 1.4X greater than margin for a cleared trade, although a recent study by the US Office of Financial Research showed that when netting, margin and guarantee fund contributions are taken into account, the total cost of clearing swaps on a CCP may in fact be more expensive than a bilateral transaction.
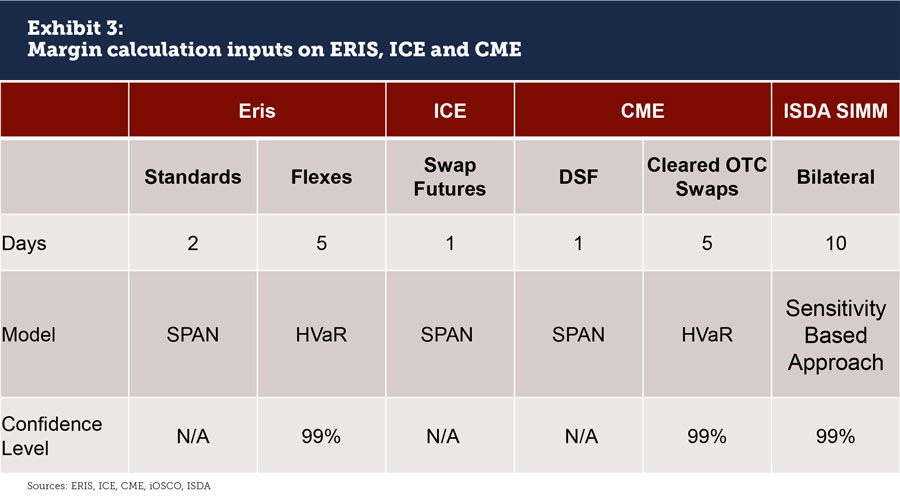
Each of these models work somewhat differently. According to the CME, “SPAN evaluates overall portfolio risk by calculating the worst possible loss that a portfolio of derivative and physical instruments might reasonably incur over a specified time period (typically one trading day).” Historical Value-at-Risk (HVaR) meanwhile looks at a historical pattern and seeks to create an X% confidence interval for determining a possible default. SPAN and VaR are not the only models at CCPs either; several CCPs, including Eurex (Prisma), LSE (PAIRS) and ICE (MAPS), have moved to their own VaR-based approaches for listed products. The difference between OTC and exchange-traded derivatives (ETD) is going to be the holding period, which is shorter for ETD products (2 vs 5 days).
CCPs have themselves expanded their offerings to include margin optimization both for individual trades and for portfolios. LCH’s Spider algorithm seeks out listed positions that could net against OTC positions and calculates both for portfolio margining. Eurex Prisma’s Liquidation Groups cover futures, options and swaps. Users can select CCP margin optimization tools in conjunction with internal models to reduce risk by moving positions from one clearing account to another, on or across multiple CCPs. The next impetus for more transparency across CCP margins might come from MiFID II, where more trade execution details will be required, and where concentrating margin at one CCP may reduce client costs.
The Revenue Impact and What-If Scenarios
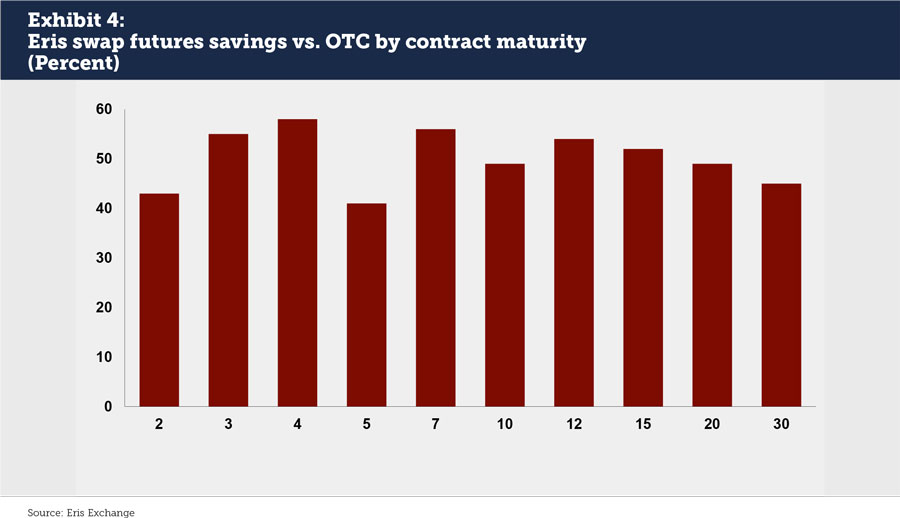
The revenue impact of margin optimization depends entirely on the firm, their portfolio, and whether trades are cleared or non-cleared. While a global figure on potential savings is unknown, individual observations show that futures margin costs beat cleared swaps: an analysis from Eris Exchange showed that margin on their swap futures ranges from 41% to 58% better than cleared swaps, depending on the maturity of the contract (see Exhibit 4). Further, using a margin optimizer beats posting whatever margin happens to be available. Under current US rules, but not proposed European rules, client margin will be captured as part of the Leverage Ratio. For a bank that is calculating its margin liabilities with no forward thought to netting requirements across CCPs and bilateral counterparties, margin costs could make an unpleasant impact on Leverage Ratio liabilities. The better plan by far is to assess portfolio-wide margin optimization opportunities.
What-if scenarios are an important part of understanding the revenue impact of margin decision-making. By sorting through best options based on the margin requirements of counterparties, firms can systematically reduce their costs by selecting the best inventory and not overpledging. A robust what-if algorithm includes the following steps in an iterative process:
• Identifying the cost of the initial transaction.
• Demonstrating which variable factors are negatively impacting the trading cost.
• Providing alternative trading scenarios that are driven by lowering capital costs.
• Potentially recommending a change to certain securities at the center of the trade for reasonable alternatives.
• Running a portfolio simulation on existing plus new positions.
Investing in Change
Not many people love change, especially the level of change that regulatory rules have imposed on financial markets in the last six years. A move towards margin optimization however is increasingly seen as a change that’s good for business and also important for competitive positioning. If one institution does not build out their capacity for margin optimization, it will cede pricing advantages to others that have taken this step forward.
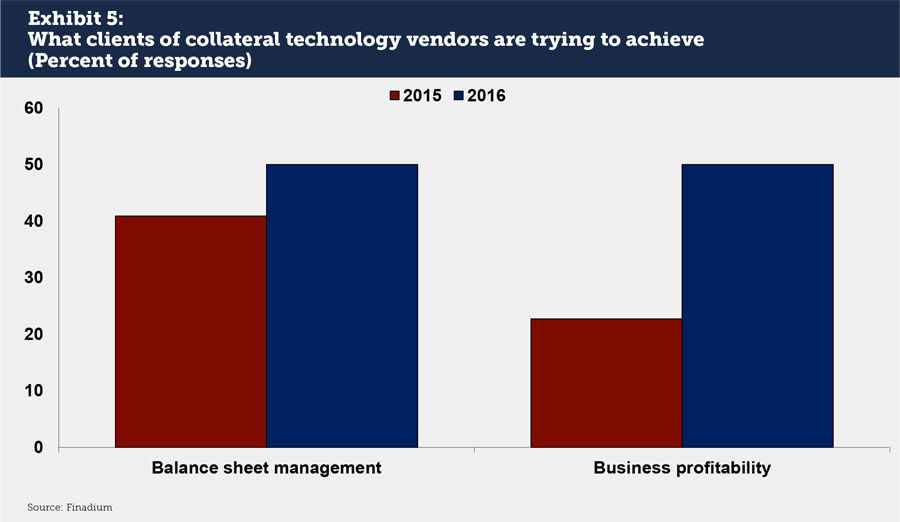
Margin optimization also fits into a broader technology trend: banks are moving past regulatory concerns and looking at a return to profitability. In a November 2016 Finadium survey of collateral technology management companies, 50% said that their clients were trying to achieve profitability through their technology investments (see Exhibit 5). This is up from 23% in 2015. Balance sheet management was also important in 2015 but saw a smaller increase in prioritization in 2016.
We expect that margin optimization – like collateral optimization before it – will become a regular part of financial technology within the next two to three years. This is a logical step for banks and investors, and sets the stage for a much greater understanding of a firm’s margin, collateral and even capital requirements on an enterprise-wide level. Taking advantage of trade compression opportunities achieves a similar objective. Margin optimization is an important move forward for banks looking to increase profitability in collateralized trading businesses; the banks who manage to implement integrated bilateral and cleared margin solutions, across ETD and OTC transactions, will be the winners of this market transformation.