


Data from the Federal Reserve’s Reverse Repo Facility (RRP) show a recurring spike at the end of each trading month. This suggests that monthly calculations on balance sheet are making an impact at US repo dealers. This is part of the historical trend of moving from quarter-end balance sheet clean-ups to month-end in response to new capital reporting requirements. How long before this process occurs daily, and what does that mean for the RRP?
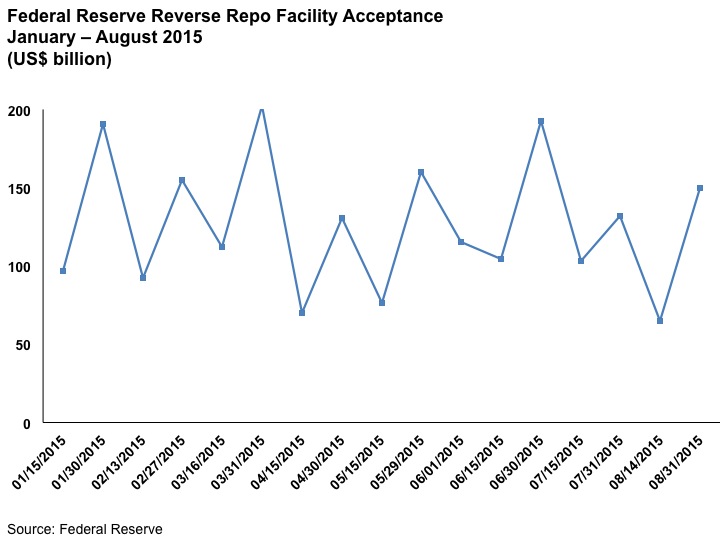
RRP data show that in every month this year, accepted bids ebbed in the middle of the month and spiked at the end (see chart below). Still, every month’s spike was under US$200 billion, compared to the US$407 billion submitted requests and US$300 billion accepted at the end of September 2014. Keep in mind also that the trading day for the RRP has almost always been from 12:45 to 1:15, meaning that the RRP is “mop up” from what cash providers couldn’t arrange with dealers. The one day so far that the RRP more actively competed with the private market was on June 30, where the RRP window ran from 9:30 to 10:00. That resulted in one of the higher end of month spikes so far this year. But month end spikes are typically higher than quarter end spikes, and one day of observation does not provide enough data to draw any conclusions yet.
The interesting part to us is linking these spikes back to trends in balance sheet management. We’ve noted in the past that multiple regulations including the need to average the last several months of month-end data were going to push banks to move away from quarterly balance sheet clean-ups (aka, “window dressing”) towards more frequent analysis. We find that the reason for the Fed RRP spike at month end is that dealers are issuing less repo to keep their books in order. Cash providers still have the need to invest, so the RRP becomes a backstop default plan.
The data also suggest that daily balance sheet management isn’t a reality yet. if it were, we would expect to see fewer RRP spikes and more consistent accepted bids across each monthly period. That means we aren’t close yet to daily netting calculations that would further constrict leverage.
As a side note, the Fed is now producing a regular graphic on collateral accepted in tri-party repo as a time series. It would be interesting to see the percentage each month that is part of the RRP as opposed to the private market. The data are available and we make this graph ourselves regularly. It would be a useful public service though for the Fed to do this too in order to facilitate the conversation about what private sector repo volumes really look like.