


OK, we admit it. We are NY Fed Liberty Street Economics blog junkies. We like their focus, although we can certainly have differing opinions. But when it comes to tri-party statistics, we are on the same page. A October 19, 2015 LSE post “The Tri-Party Repo Market Like You Have Never Seen It Before” by is the gateway into a new graphic interface on tri-party data. It is fun to play around with and we recommend you give it a look.
Trends in tri-party repo are instructive to students of securities financing. Dealers use tri-party to fund themselves, borrowing cash from money funds and other liquidity providers. It can give some interesting clues about the overall size of the repo market (at least until efforts to measure the bilateral repo market by the Fed and other regulators bear some fruit), what kind of collateral is out there, and how liquidity providers look at haircuts.
Unlike bilateral repo markets where haircuts are (at least theoretically) negotiable on a trade-by-trade basis, tri-party haircuts tend to be sticky. Given that tri-party repos are schedule driven and require documentation specialists to get involved to change anything (a process often measured in weeks) it is not surprising that haircuts don’t change much. We saw that in the financial crisis where bilateral trading had volatile haircuts, in effect creating a pressure relief valve that kept the market open, tri-party seemed more of a “take it or leave it” proposition (creating repo runs). So what do haircuts look like now?
The Fed data divides collateral into Fedwire eligible and non-Fedwire eligible. This distinction runs parallel to HQLA and more credit sensitive paper. The list is as follows:
Fedwire-eligible:
- Agency CMOs
- Agency Debentures and Strips
- Agency MBS
- US Treasuries Strips
- US Treasuries excluding Strips
Non-Fedwire:
- ABS Investment Grade
- ABS Non-Investment Grade
- CDOs
- CDOs Private Label Investment Grade
- CMO Private Label Non-Investment Grade
- Corporates Investment Grade
- Corporates Non-Investment Grade
- Equities
- International Securities
- Money Market
- Municipal Debt
- Whole Loans
- Other
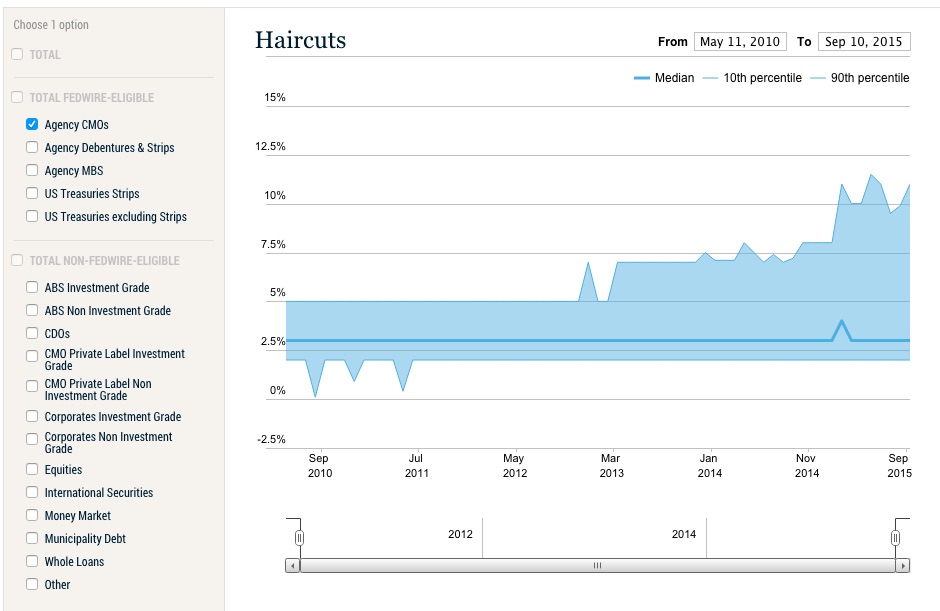
Haircut information on Fedwire-eligible paper is, frankly, not that interesting. The exception are Agency CMOs. The Fed data provides 10% and 90% percentile haircut as well as median haircut information. For Agency CMOs, the most recent median was 3% but the 10% and 90% percentile data was 2% and 11% respectively. That is a wide spread (especially in the context that Agency MBS 10%/90% numbers are 2% and 3%).
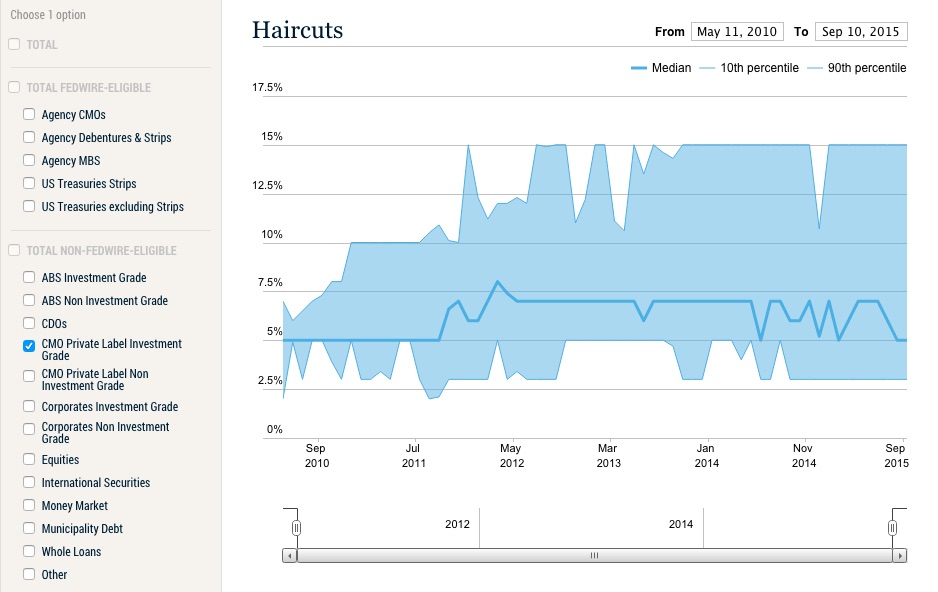
Looking at Private Label Investment Grade CMOs, the median haircut is 5%, with 10%/90% levels at 3% and 15% respectively. Clearly the Private Label paper is riskier without the agency wrapper and haircuts reflect it.
Having said that, Agency CMOs and Private Label CMOs don’t comprise a big percentage of the tri-party collateral pool. The entire tri-party world is about $1.6 trillion. Agency CMOs account for 5% of the market, Private Label (Investment Grade and Non-Investment Grade) are less than 3%. This compares to US Treasuries excluding Strips at 41% of the collateral pool.
We have wondered what does a bank credit officer think when looking at the haircut data? Do they benchmark what they ask hedge funds to pay based on this information? How would they feel if they find out they are at the low end of the haircut range? And what do money funds, for example, think when they see what other liquidity providers are getting for haircuts?
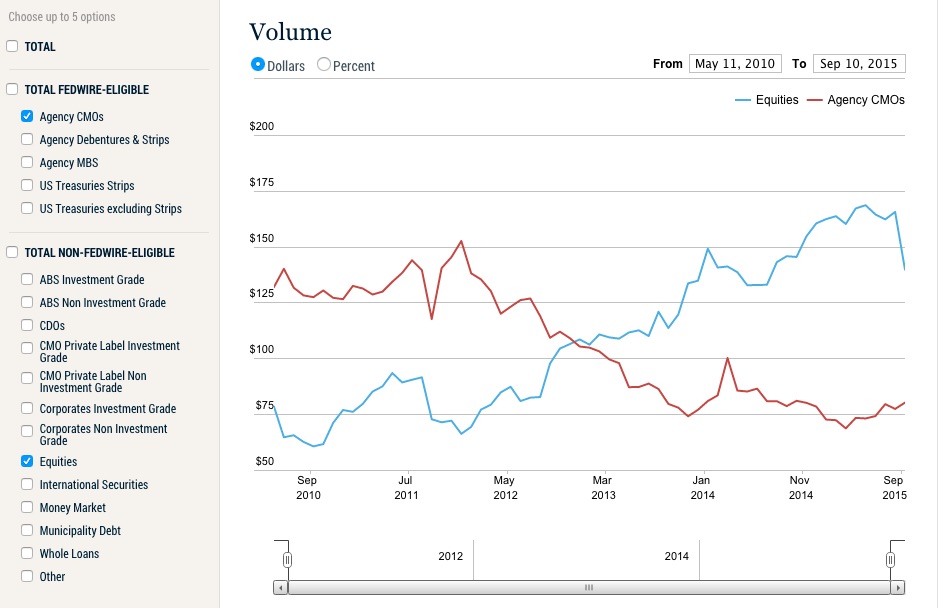
So what about market trends? Lets compare equities to Agency CMOs. There seems to have been something of a reversal with Agency CMOs falling from about 8% of the collateral pool in May, 2010 (when the data set starts) to 5% now. Equities, on the other hand, rose from 4.7% ($78 billion) to 8.7% ($140 billion) over the same period. Of course the DJIA went from 10,260 on May 10, 20101 to 17,217 on October 19, 2015. Equities, as tri-party collateral, topped out at $168 billion on May 11th, the same day the DJIA most recent peak at 18,272 — hardly a coincidence. Fixed income products have not been very exciting over the same period (with some exceptions).
These are just a couple interesting ways to use the new tri-party graphical interface. Its a great tool and we urge you to play around with it.